Fig. 7
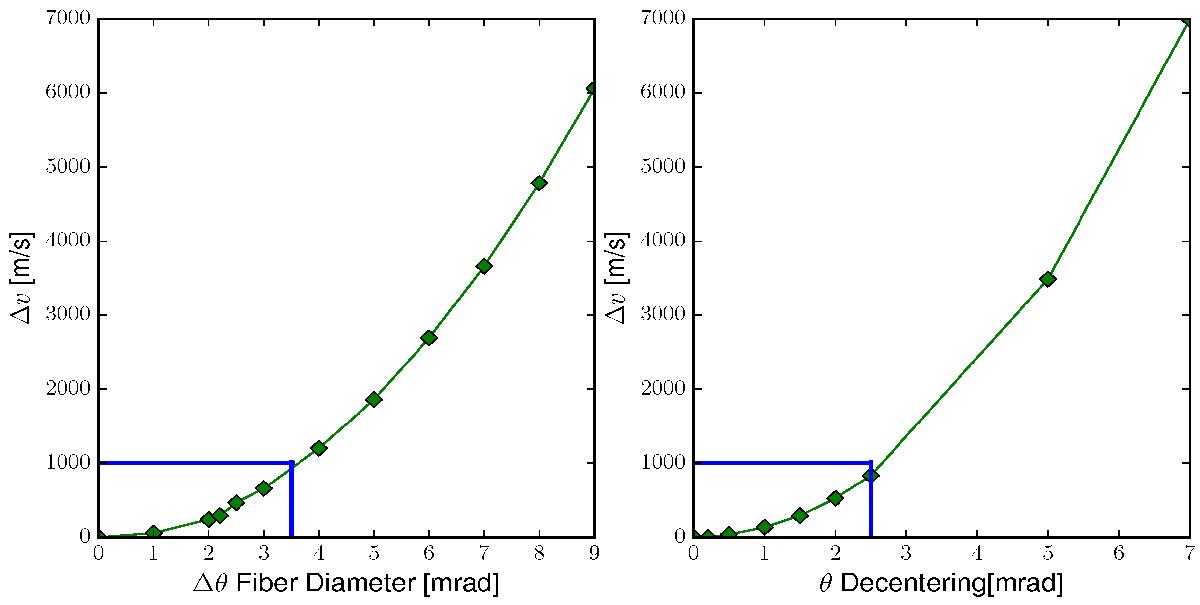
Change in radial velocity for a centred fibre as a function of fibre diameter (left) and as a function of fibre de-centring (right) for a fixed fibre diameter D = 200 μm. The blue line marks the limit area we are interested in. The area is small because small changes introduces shift of several hundreds or more of m s-1 in both cases.
Current usage metrics show cumulative count of Article Views (full-text article views including HTML views, PDF and ePub downloads, according to the available data) and Abstracts Views on Vision4Press platform.
Data correspond to usage on the plateform after 2015. The current usage metrics is available 48-96 hours after online publication and is updated daily on week days.
Initial download of the metrics may take a while.