Fig. 5
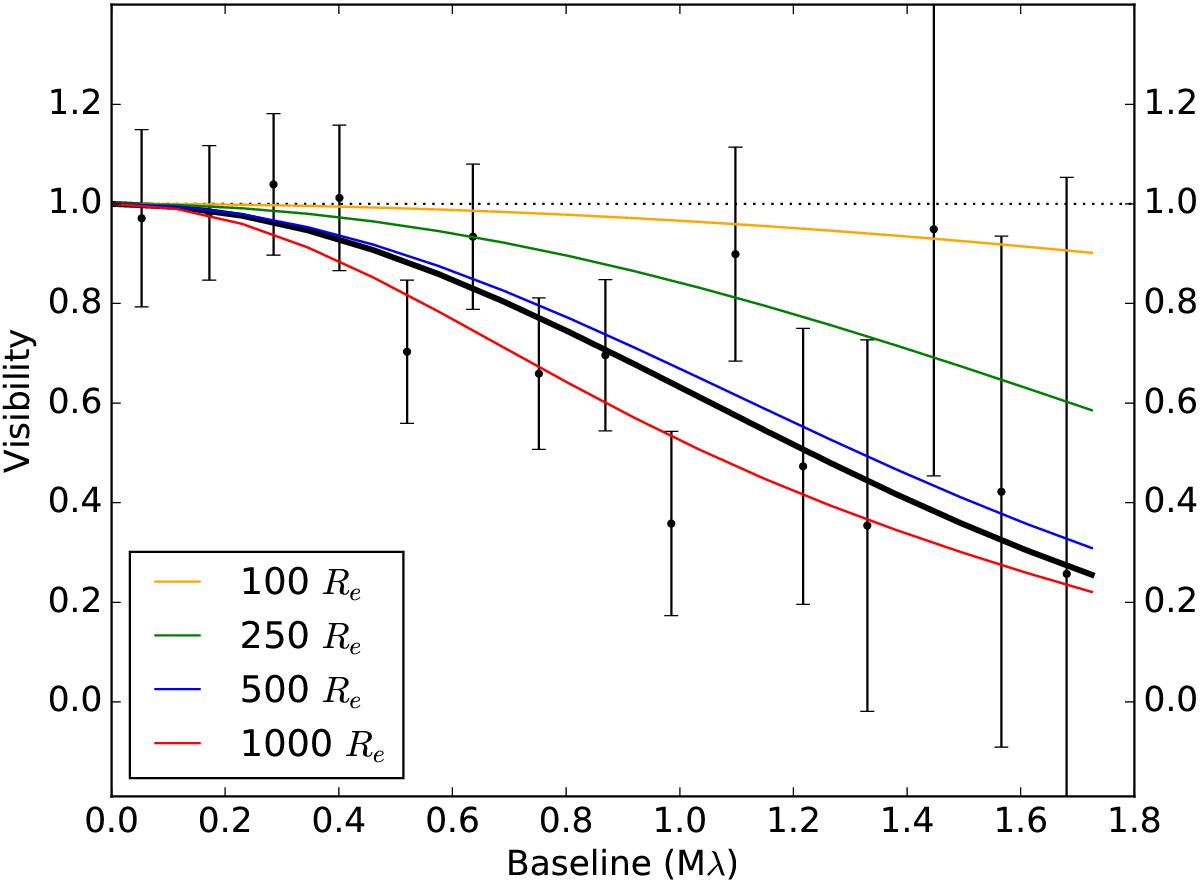
ψ Per: azimuthally averaged visibility data of Dougherty & Taylor (1992, black points with error bars) and a Gaussian fit to them (thick black line, FWHM of 74 mas corresponding to 518 Re) over-plotted with the visibility curves derived from our azimuthally averaged models with several different disk sizes indicated in the legend. The dotted line shows the visibility curve of a point source (visibility equal to unity with increasing baseline length).
Current usage metrics show cumulative count of Article Views (full-text article views including HTML views, PDF and ePub downloads, according to the available data) and Abstracts Views on Vision4Press platform.
Data correspond to usage on the plateform after 2015. The current usage metrics is available 48-96 hours after online publication and is updated daily on week days.
Initial download of the metrics may take a while.