Free Access
Fig. 8
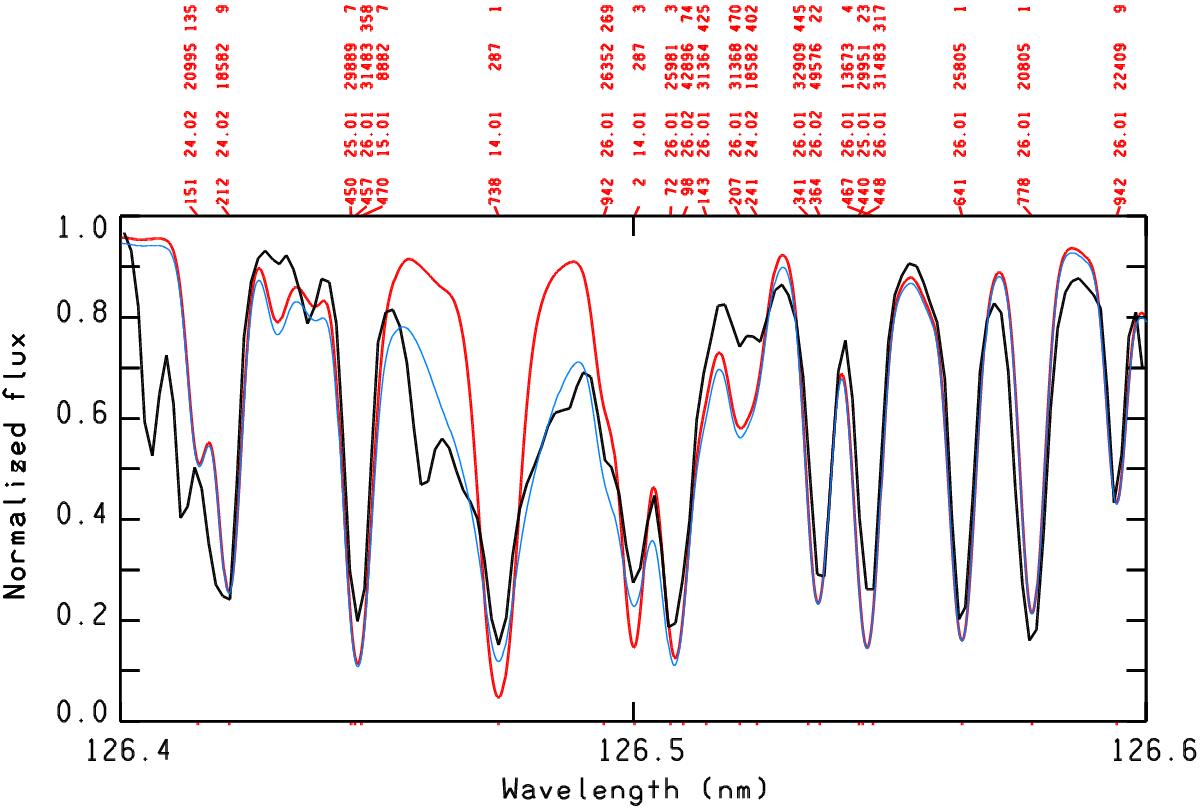
Si ii lines at 1264.738 Å and 1265.002 Å computed with the average silicon abundance −7.35 dex (red line) and the abundance step function of Fig. 7b (blue line). The computed spectra are superimposed on the observed spectrum (black line).
Current usage metrics show cumulative count of Article Views (full-text article views including HTML views, PDF and ePub downloads, according to the available data) and Abstracts Views on Vision4Press platform.
Data correspond to usage on the plateform after 2015. The current usage metrics is available 48-96 hours after online publication and is updated daily on week days.
Initial download of the metrics may take a while.