Fig. 3
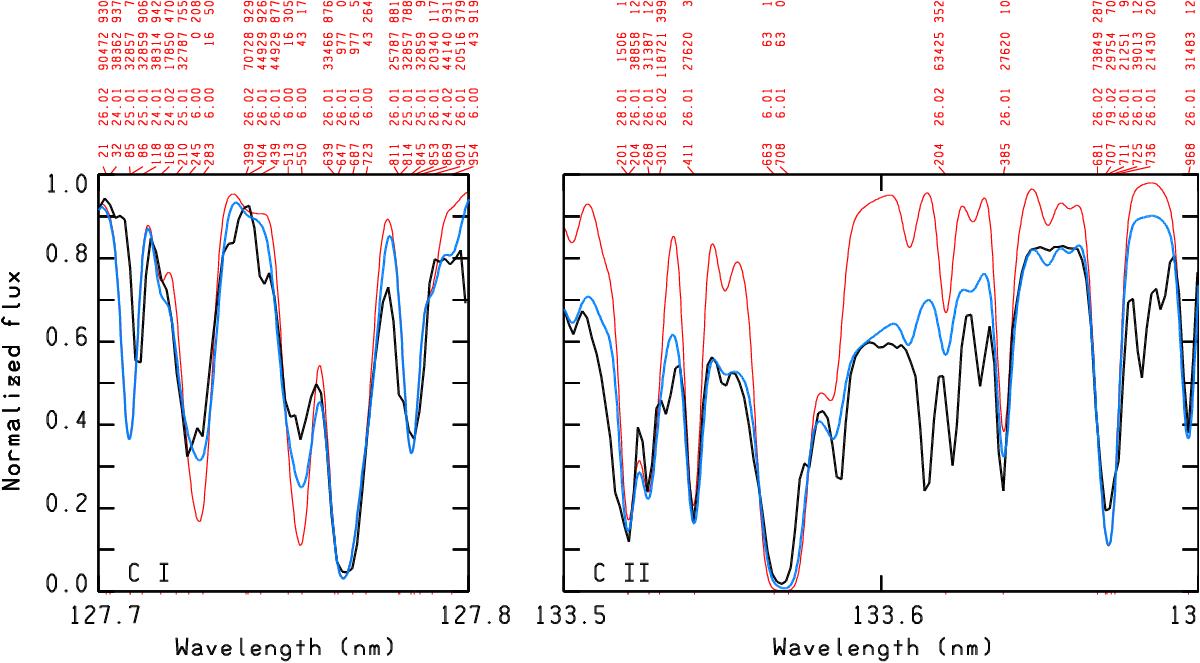
C i lines of UV mult. 7 (λλ 1277.245, 1277.283, 1277.513, 1277.550, 1277.273, and 1277.954 Å) and the C ii blend at λλ 1335.663, 1335.708 Å computed with both the average carbon abundances of −5.5 dex (red line) and the abundance step function shown in Fig. 2b (blue line) are compared each with other and with the observed spectrum (black line).
Current usage metrics show cumulative count of Article Views (full-text article views including HTML views, PDF and ePub downloads, according to the available data) and Abstracts Views on Vision4Press platform.
Data correspond to usage on the plateform after 2015. The current usage metrics is available 48-96 hours after online publication and is updated daily on week days.
Initial download of the metrics may take a while.