Free Access
Fig. 2
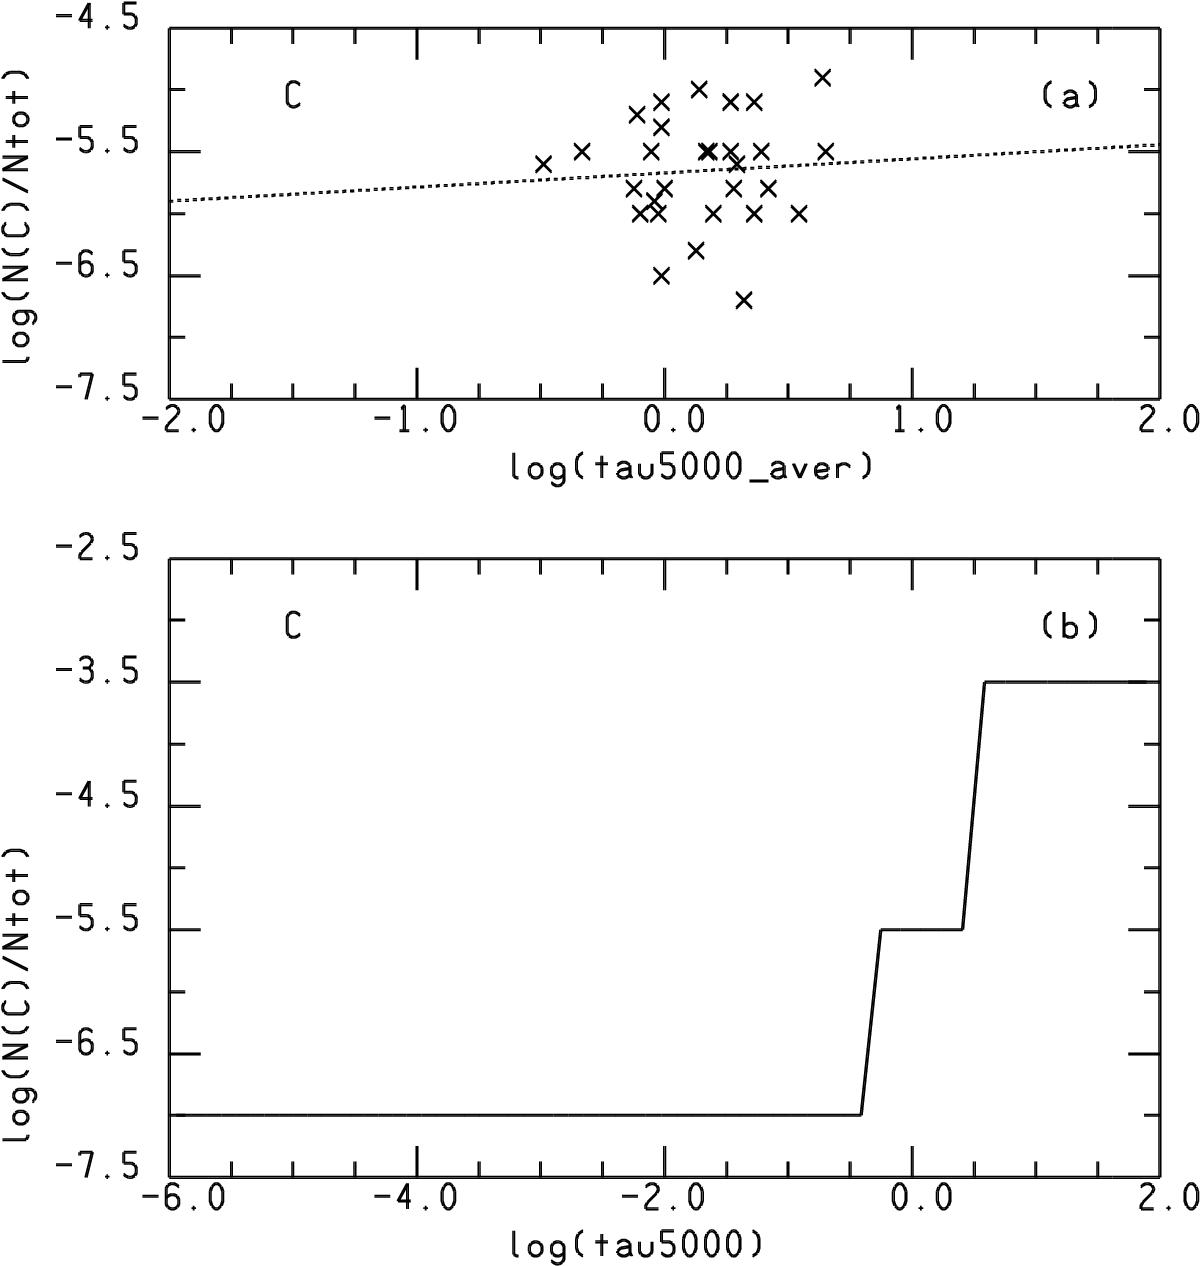
a) C i abundance versus log τ5000(aver), average depth of line formation on the log τ5000 scale. The dashed line is the best fit straight line to the plotted points. b) Vertical abundance distribution as function of log τ5000 obtained by the trial and error applied to C ii λλ 1335.663, 1335.708 Å.
This figure is made of several images, please see below:
Current usage metrics show cumulative count of Article Views (full-text article views including HTML views, PDF and ePub downloads, according to the available data) and Abstracts Views on Vision4Press platform.
Data correspond to usage on the plateform after 2015. The current usage metrics is available 48-96 hours after online publication and is updated daily on week days.
Initial download of the metrics may take a while.