Fig. 10
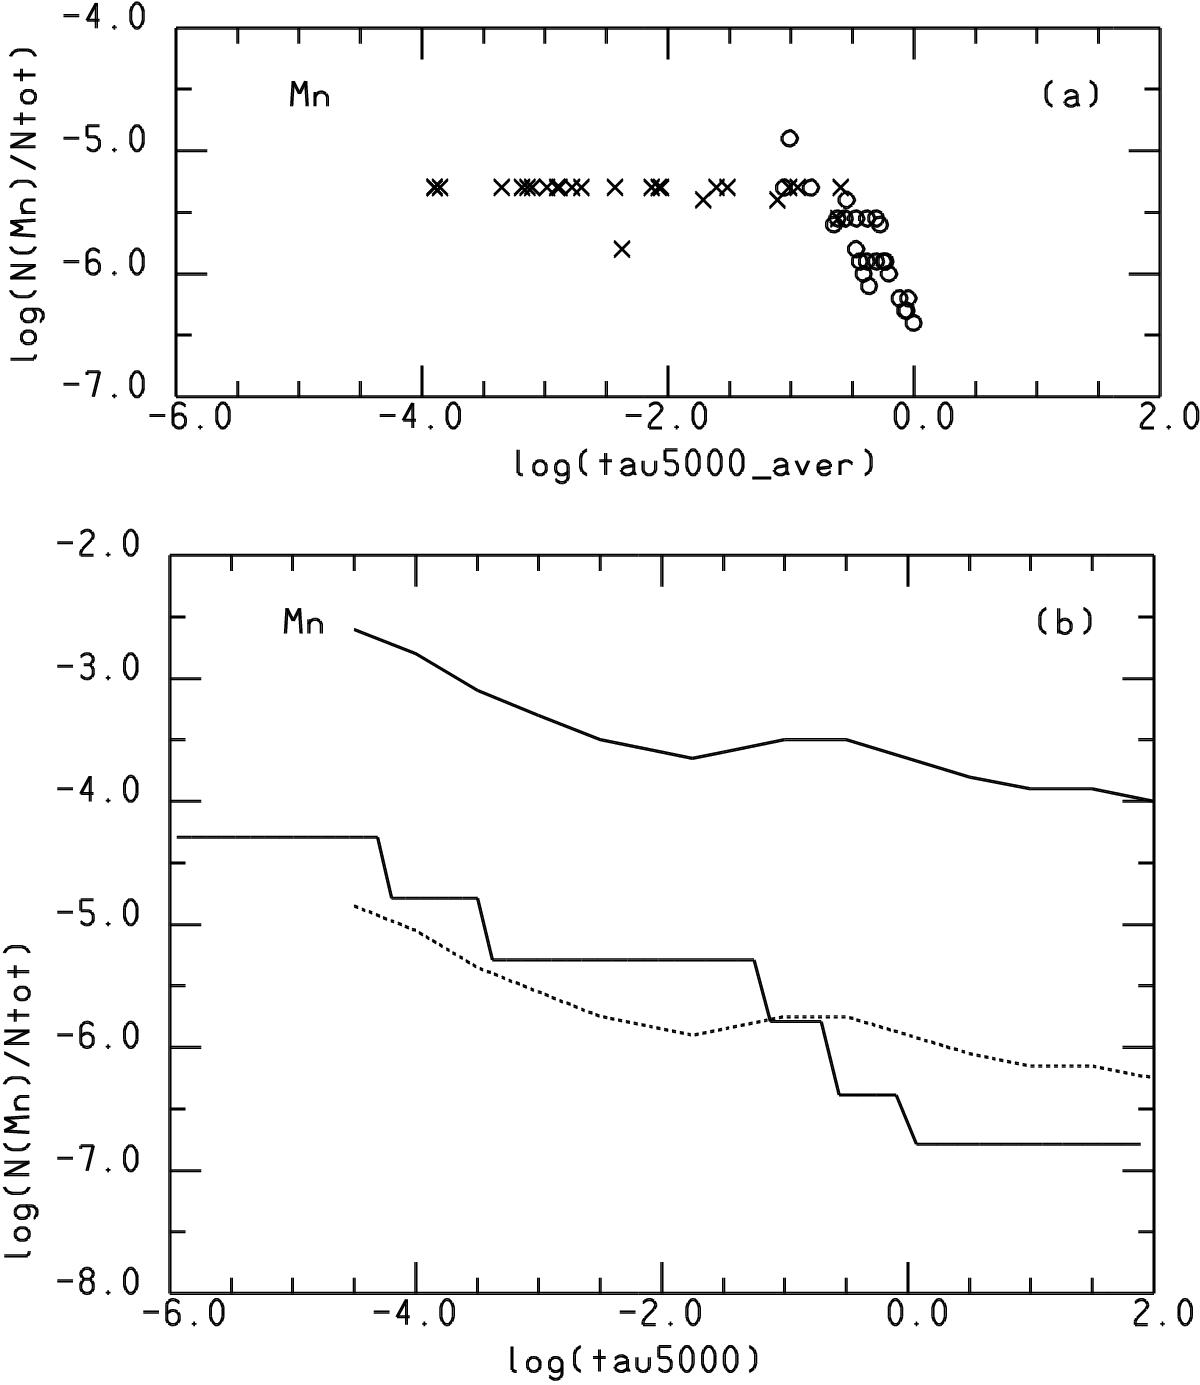
a) Manganese abundance versus log τ5000(aver); crosses are for Mn ii, circles for Mn iii. b) Vertical abundance distribution as a function of log τ5000 obtained by trial and error. The theoretical vertical stratification for Teff = 14 000 K, log g = 4.0 from Alecian & Stift (2010) is overplotted (full continous line). The dashed line is the same curve shifted by −2.25 dex in the abundance.
Current usage metrics show cumulative count of Article Views (full-text article views including HTML views, PDF and ePub downloads, according to the available data) and Abstracts Views on Vision4Press platform.
Data correspond to usage on the plateform after 2015. The current usage metrics is available 48-96 hours after online publication and is updated daily on week days.
Initial download of the metrics may take a while.