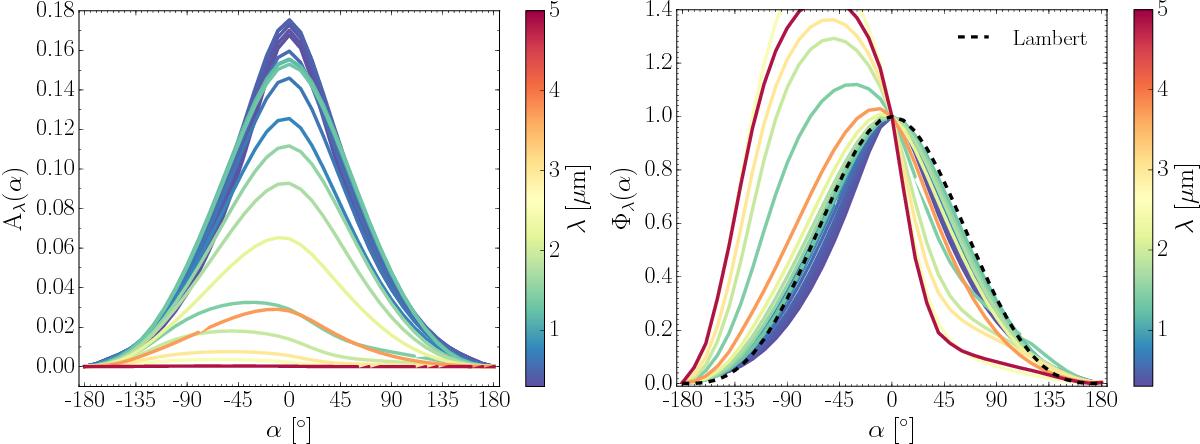
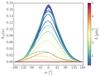
Fig. 5
Download original image
Left: scattered light phase curves of the albedo spectra Aλ(α) (Eq. (31)) of our HD 189733b simulation between 0.3 μm (colour bar: dark purple) to 5.0 μm (colour bar: dark red). Optical and near-IR wavelength packets are more strongly scattered than longer IR wavelengths. Right: classical phase function (Eq. (33)), which emphasises the phase curve shapes. Optical wavelengths are more symmetric about the sub-stellar point, IR wavelengths show more variation with phase. A Lambertian phase function (black, dashed line) is over-plotted for reference, which is useful for characterising scattering behaviour (see text).
Current usage metrics show cumulative count of Article Views (full-text article views including HTML views, PDF and ePub downloads, according to the available data) and Abstracts Views on Vision4Press platform.
Data correspond to usage on the plateform after 2015. The current usage metrics is available 48-96 hours after online publication and is updated daily on week days.
Initial download of the metrics may take a while.