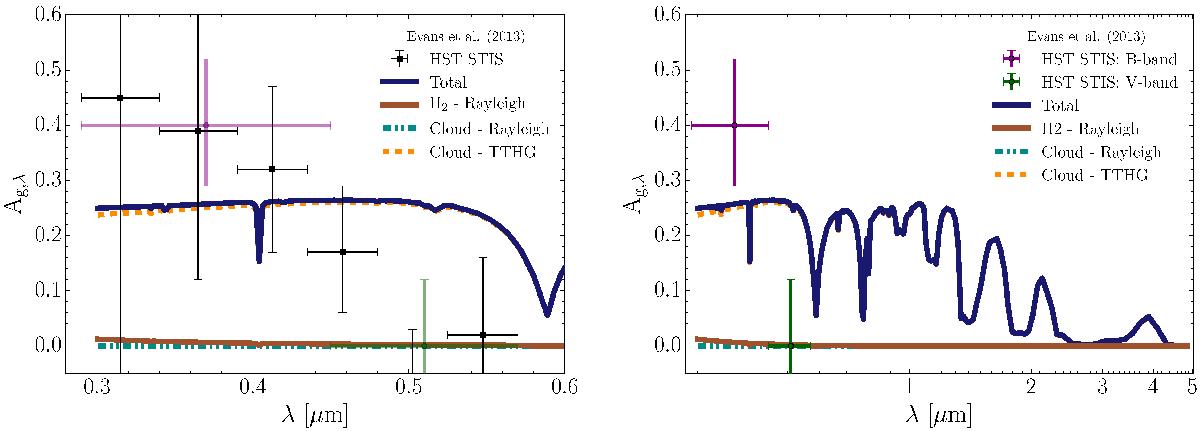
Fig. 3
Download original image
Scattered light apparent geometric albedo Ag,λ (Eq. (32)) of our HD 189733b simulation output compared to Evans et al. (2013)’s individual HST STIS measurements. The total contribution is indicated by the solid blue line; TTHG cloud particle scattering by the dashed orange line; Rayleigh cloud particle scattering by the teal dash-dotted line; H2 Rayleigh scattering by the brown solid line. Left (0.29−0.6 μm): the Rayleigh and TTHG model is generally consistent with the B band HST STIS measurements, but does not predict the low albedo of the V band. Right (0.29−5 μm): extended spectra from 0.3−5 μm, showing the convolved B band and V band measurements from Evans et al. (2013). Ag,λ becomes negligible beyond 5 μm.
Current usage metrics show cumulative count of Article Views (full-text article views including HTML views, PDF and ePub downloads, according to the available data) and Abstracts Views on Vision4Press platform.
Data correspond to usage on the plateform after 2015. The current usage metrics is available 48-96 hours after online publication and is updated daily on week days.
Initial download of the metrics may take a while.