Fig. 10

Download original image
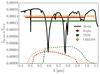
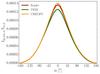
Combined scattered and emitted light flux ratio Lp,tot,λ/L⋆.λ HD 189733b predictions for the Kepler, TESS, and CHEOPS instruments. Left: predicted dayside flux ratio for Kepler (red dot), TESS (green square) and CHEOPS (orange diamond) photometric bandpasses. The solid black line is the model output. Dashed lines indicate the spectral response function of the instrument. Right: predicted Kepler (red), TESS (green) and CHEOPS (orange) flux ratio phase curves. All three instruments show no/little offset from the sub-stellar point, we predict a westward maximum flux offset of only −5°−0° from the sub-stellar point.
Current usage metrics show cumulative count of Article Views (full-text article views including HTML views, PDF and ePub downloads, according to the available data) and Abstracts Views on Vision4Press platform.
Data correspond to usage on the plateform after 2015. The current usage metrics is available 48-96 hours after online publication and is updated daily on week days.
Initial download of the metrics may take a while.