Fig. 9
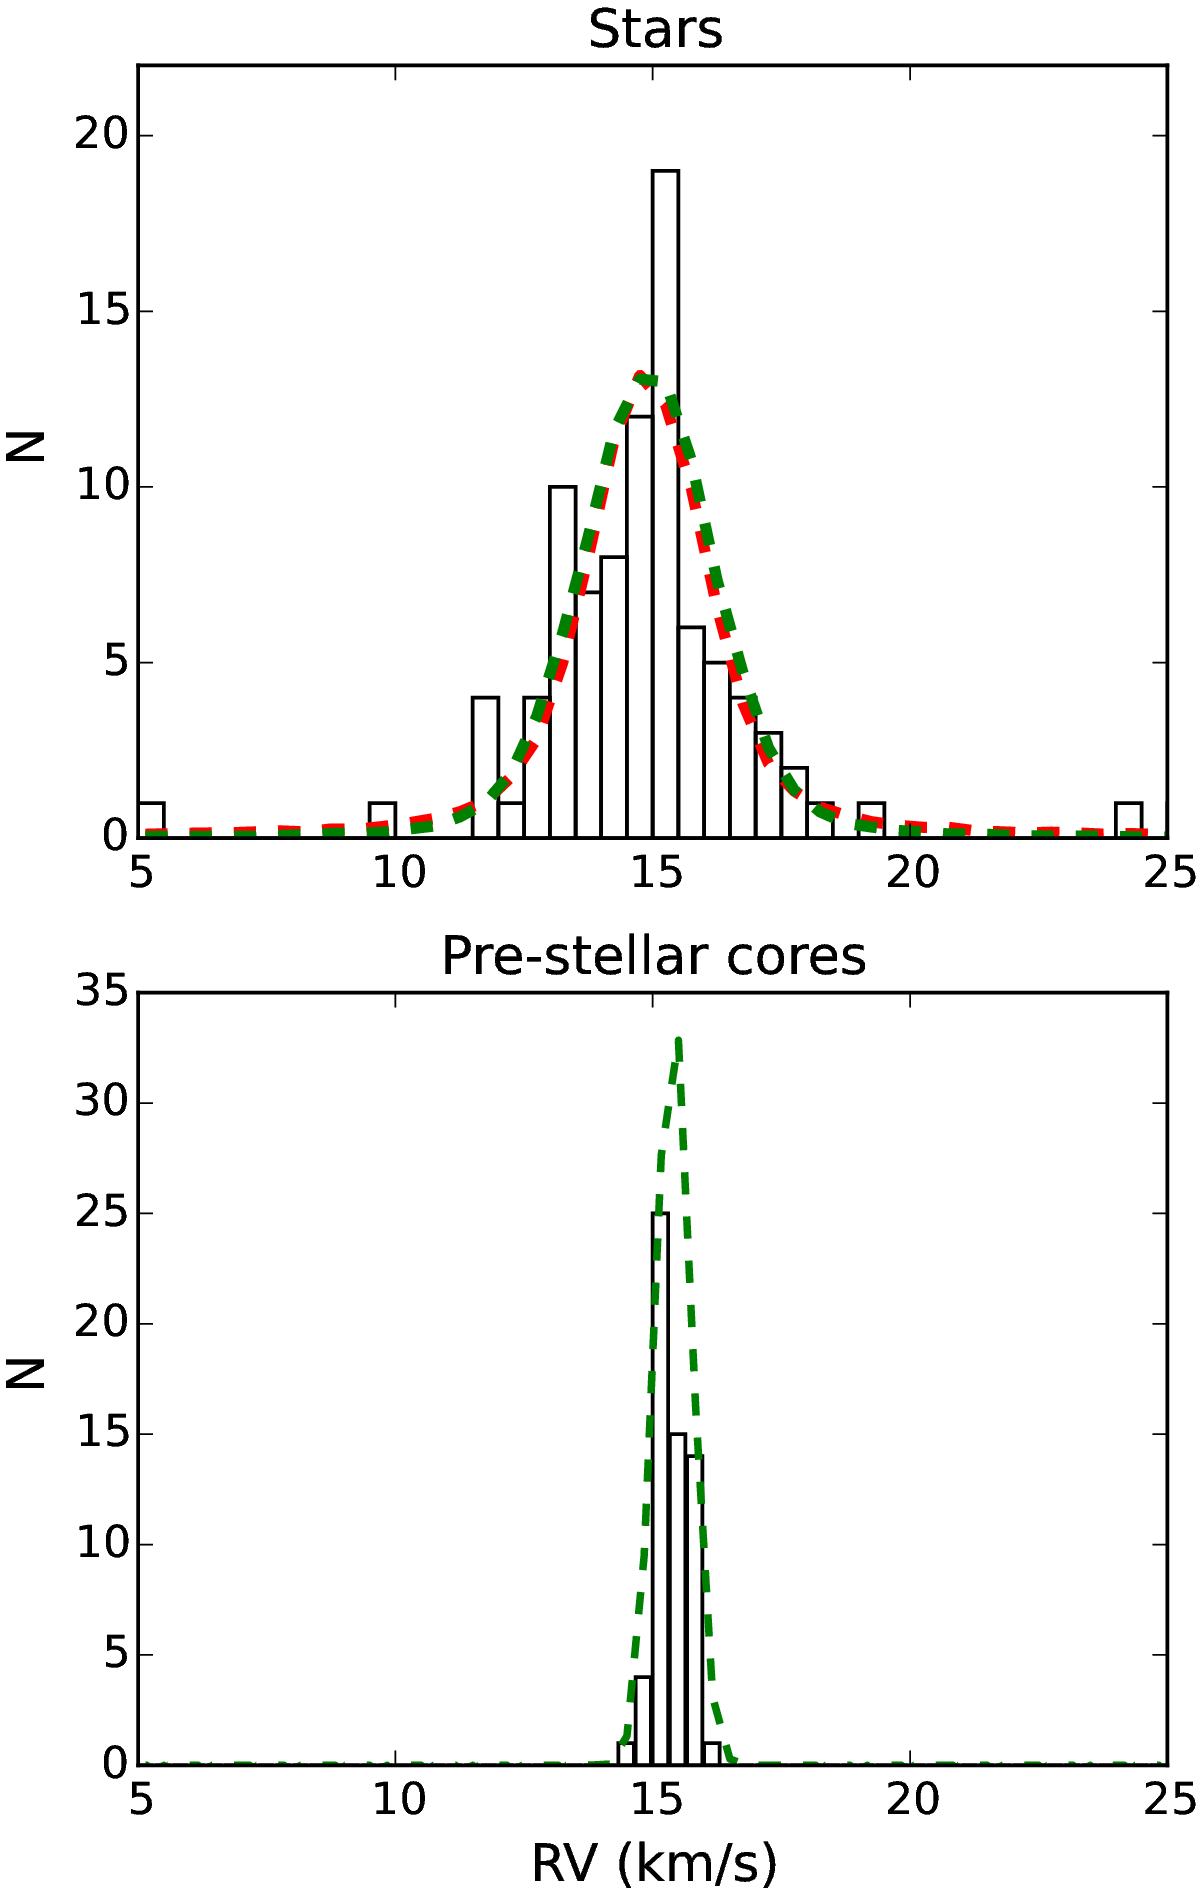
Top: RV distribution of the full sample of cluster members observed by GES. The red and green dashed lines describe the best-fit models with a Gaussian broadened by the measurement errors and the velocity offsets due to binaries, assuming a fixed binary fraction (fbin = 0.5) and leaving the binary fraction free to vary, respectively. Bottom: distribution of the RVs of the pre-stellar cores measured by Tsitali et al. (2015) from the C18O (2−1) molecular transition, with the best-fit models with a Gaussian function superimposed.
Current usage metrics show cumulative count of Article Views (full-text article views including HTML views, PDF and ePub downloads, according to the available data) and Abstracts Views on Vision4Press platform.
Data correspond to usage on the plateform after 2015. The current usage metrics is available 48-96 hours after online publication and is updated daily on week days.
Initial download of the metrics may take a while.