Fig. 8
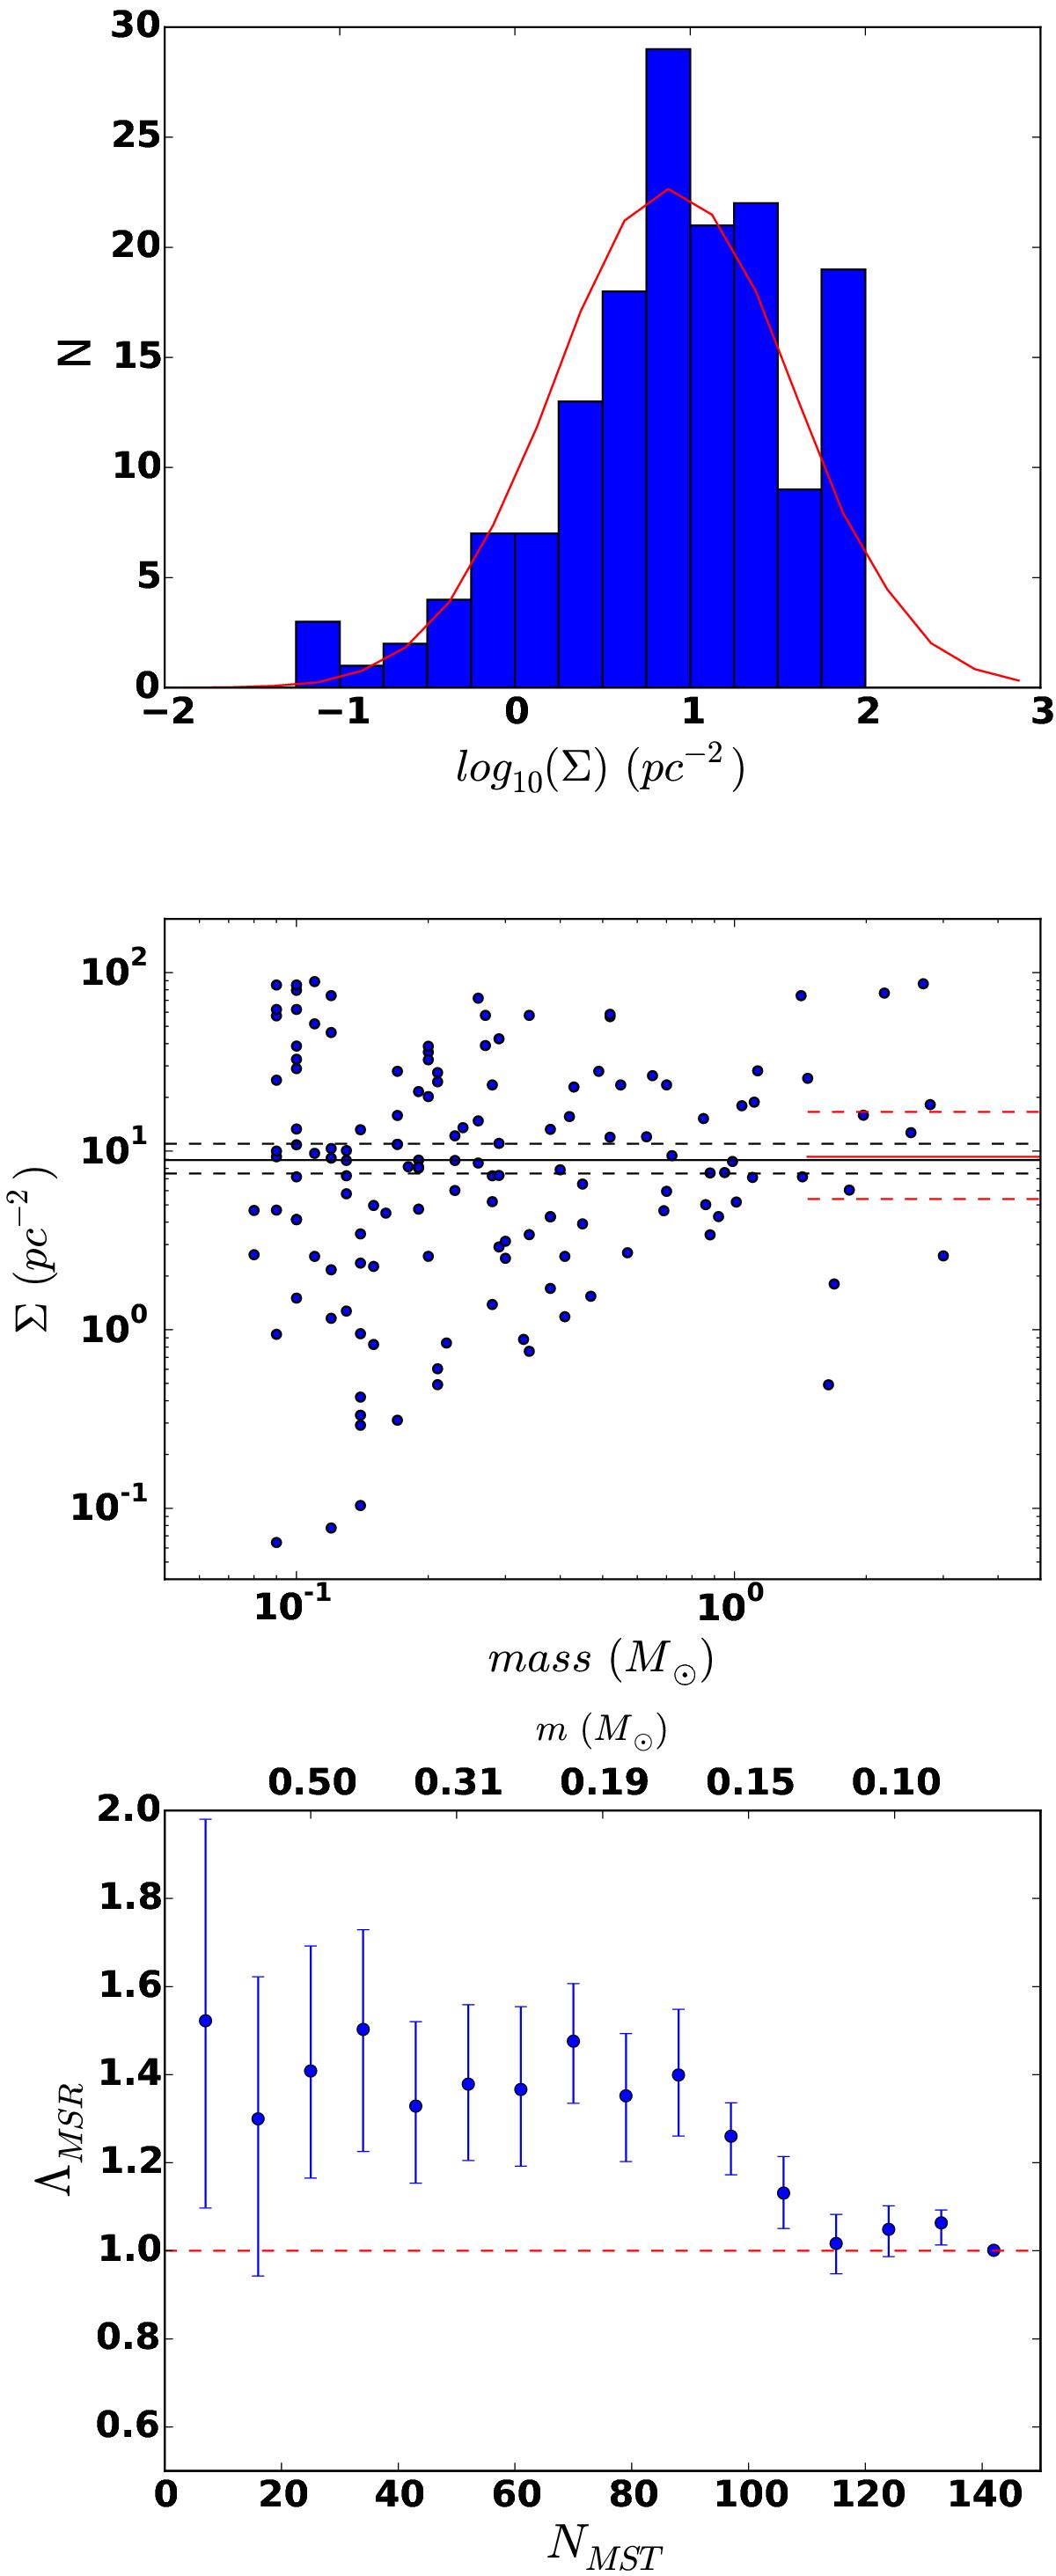
Top: distribution of the surface density Σ and the best-fit model with a lognormal function (continuous red line). Middle: stellar density as defined in Eq. (3) as a function of the star mass. The black and red lines indicate the median density of the whole stellar sample and the ten most massive stars, respectively. The continuous lines represent the best value, while the dashed lines represent their error bars. Bottom: evolution of the mass segregation ratio, ΛMSR, for the NMST most massive stars. The top x-axis indicates the lowest mass star mL within NMST and the dashed line corresponds to ΛMSR = 1, i.e., no mass segregation.
Current usage metrics show cumulative count of Article Views (full-text article views including HTML views, PDF and ePub downloads, according to the available data) and Abstracts Views on Vision4Press platform.
Data correspond to usage on the plateform after 2015. The current usage metrics is available 48-96 hours after online publication and is updated daily on week days.
Initial download of the metrics may take a while.