Fig. 6
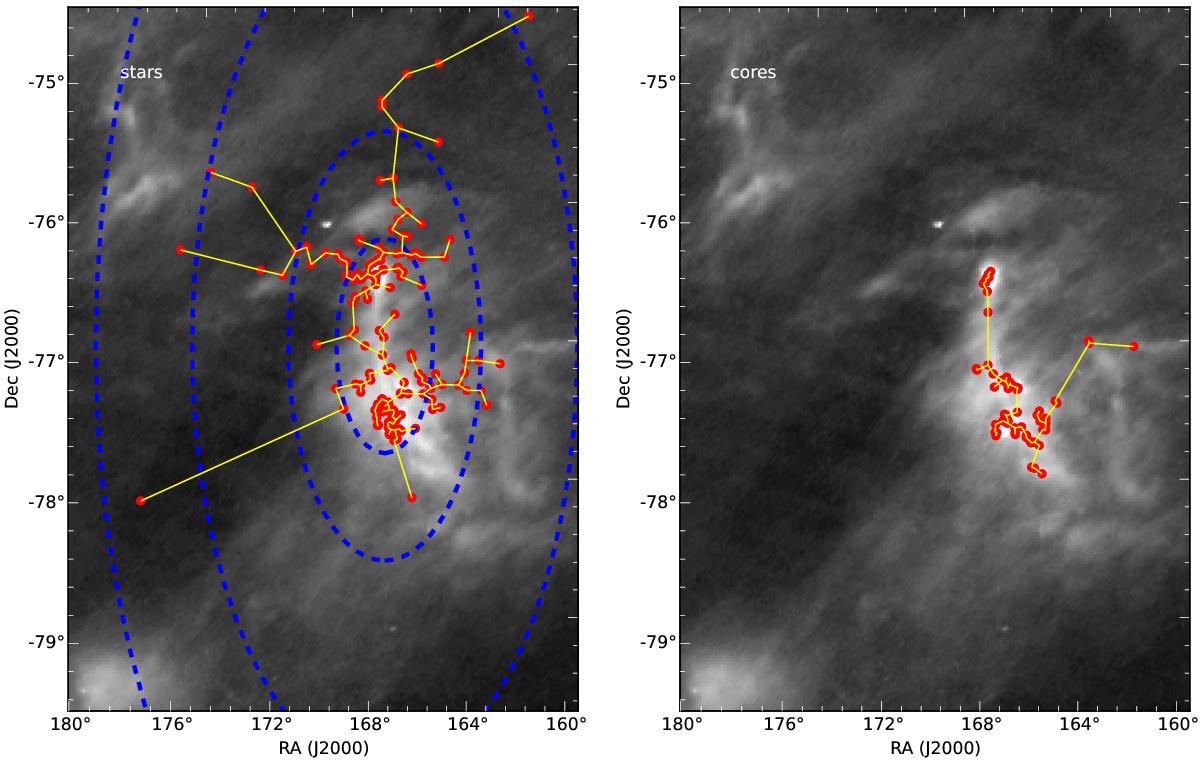
Spatial distribution of the stars (left panel) and starless cores (right panel) used to calculate the Q parameter. The minimum spanning tree is plotted with a yellow line. The blue dashed lines in the left panel show the elliptic boundaries of the regions including the stars used to calculate the values of the Q parameter reported in Fig. 7.
Current usage metrics show cumulative count of Article Views (full-text article views including HTML views, PDF and ePub downloads, according to the available data) and Abstracts Views on Vision4Press platform.
Data correspond to usage on the plateform after 2015. The current usage metrics is available 48-96 hours after online publication and is updated daily on week days.
Initial download of the metrics may take a while.