Fig. 4
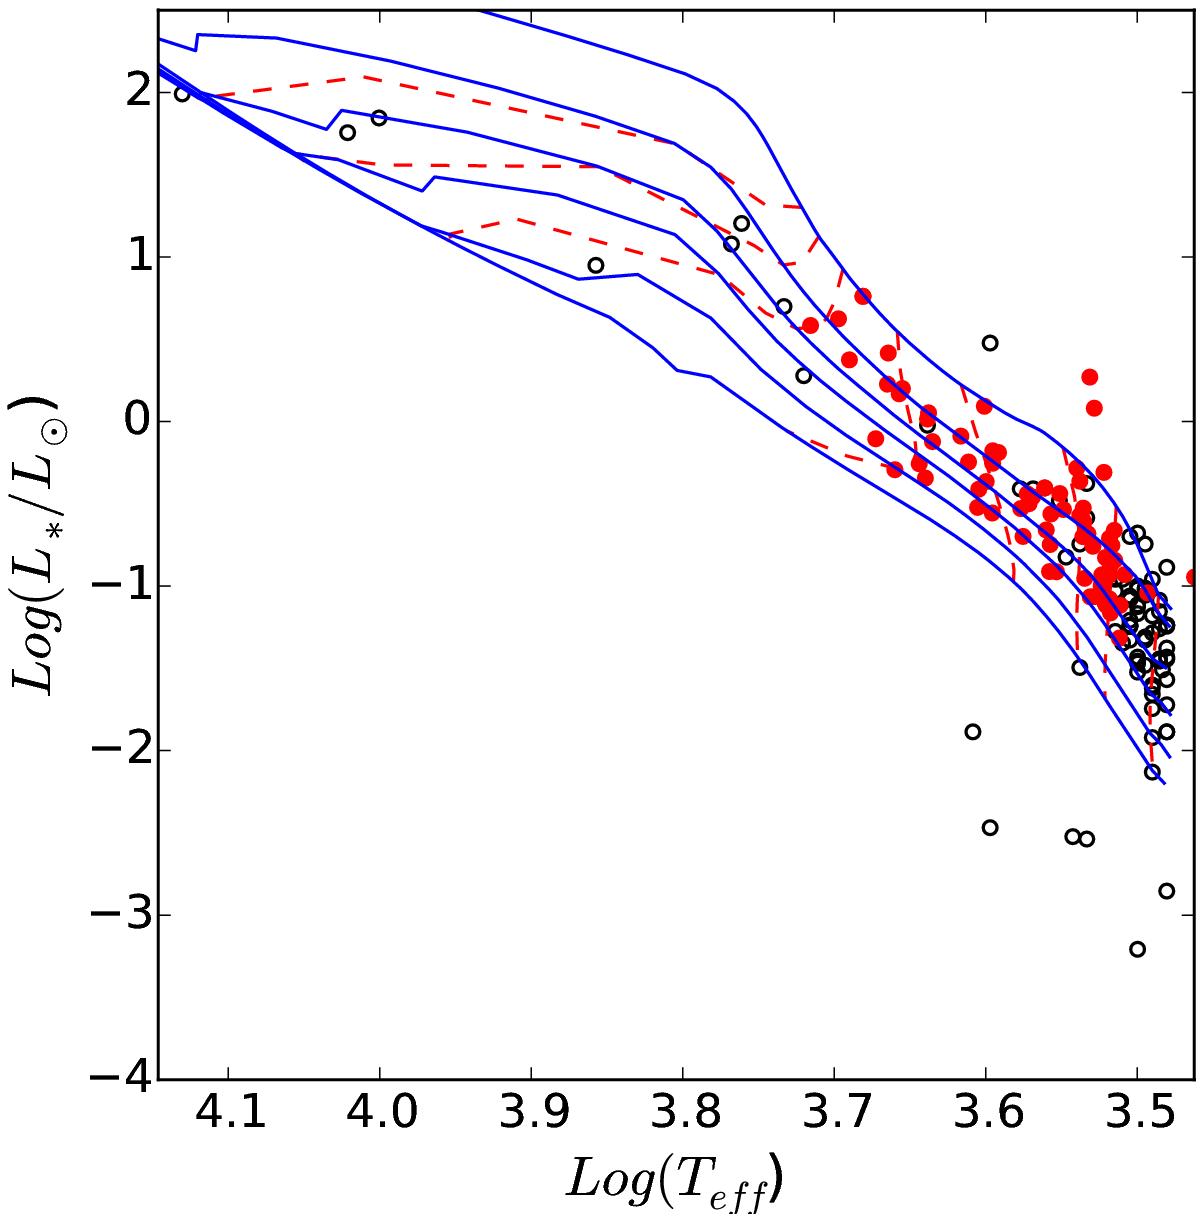
HR diagram of members in Cha I selected from the literature and the GES data with AJ < 1.2 and Teff > 3000 K. Temperatures and luminosities have been derived from the GES spectra and the 2MASS photometry for the red dots, and from the literature for the other stars. Isochrones (at 0.5, 1.5, 3.0, 5.0, 10.0, and 20.0 Myr) and tracks (at 0.1, 0.2, 0.3, 0.6, 1.0, 1.8, 2.4, and 3.0 solar masses) from an improved version of the Tognelli et al. (2011, 2012) pre-main sequence evolutionary models are reported with continuous blue and dashed red lines, respectively.
Current usage metrics show cumulative count of Article Views (full-text article views including HTML views, PDF and ePub downloads, according to the available data) and Abstracts Views on Vision4Press platform.
Data correspond to usage on the plateform after 2015. The current usage metrics is available 48-96 hours after online publication and is updated daily on week days.
Initial download of the metrics may take a while.