Fig. 2
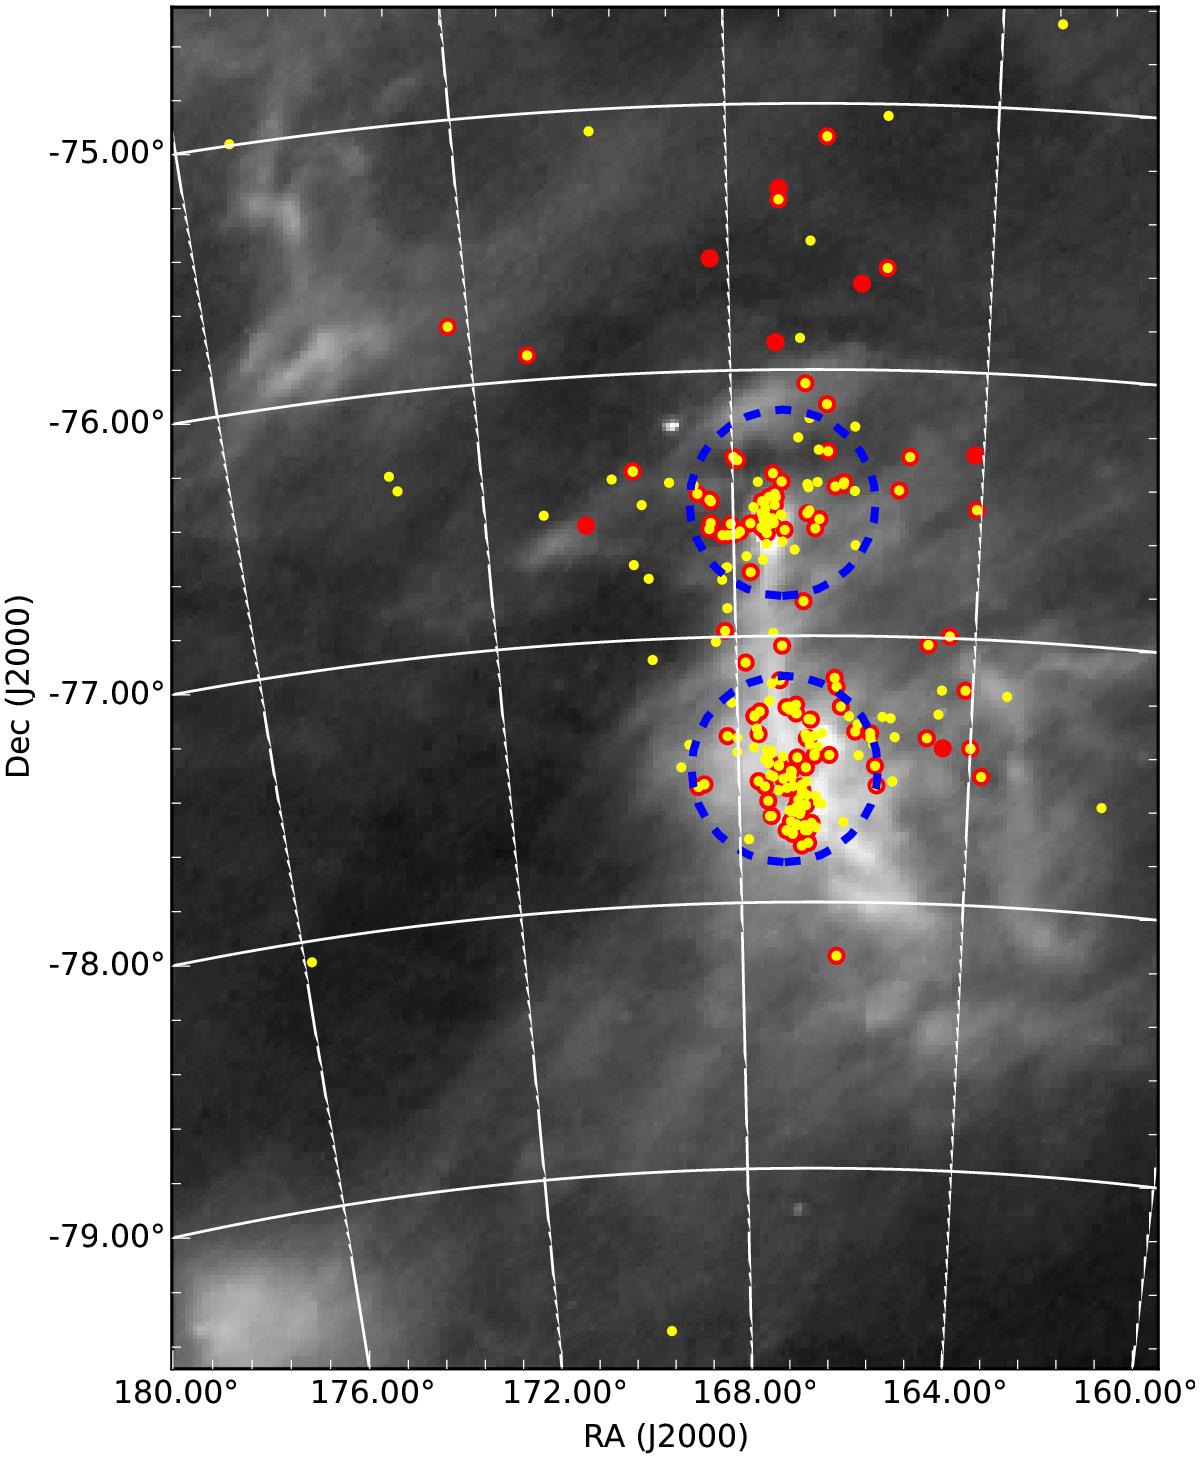
Far infrared (140 μm) map of the region around the young cluster Cha I from the AKARI all-sky survey (Doi et al. 2015). Yellow dots indicate the positions of all the known members from the literature, while the bigger red dots indicate the positions of all the members selected by the GES observations according to the criteria discussed in Sect. 3. The dashed blue circles (centers RA1 = 167.2°, Dec1 = –76.5°, RA2 = 167.2°, Dec2 = –77.5°, and radius 0.35°) delimit the north and south subclusters (see Sects. 4.2 and 5.3).
Current usage metrics show cumulative count of Article Views (full-text article views including HTML views, PDF and ePub downloads, according to the available data) and Abstracts Views on Vision4Press platform.
Data correspond to usage on the plateform after 2015. The current usage metrics is available 48-96 hours after online publication and is updated daily on week days.
Initial download of the metrics may take a while.