Fig. 11
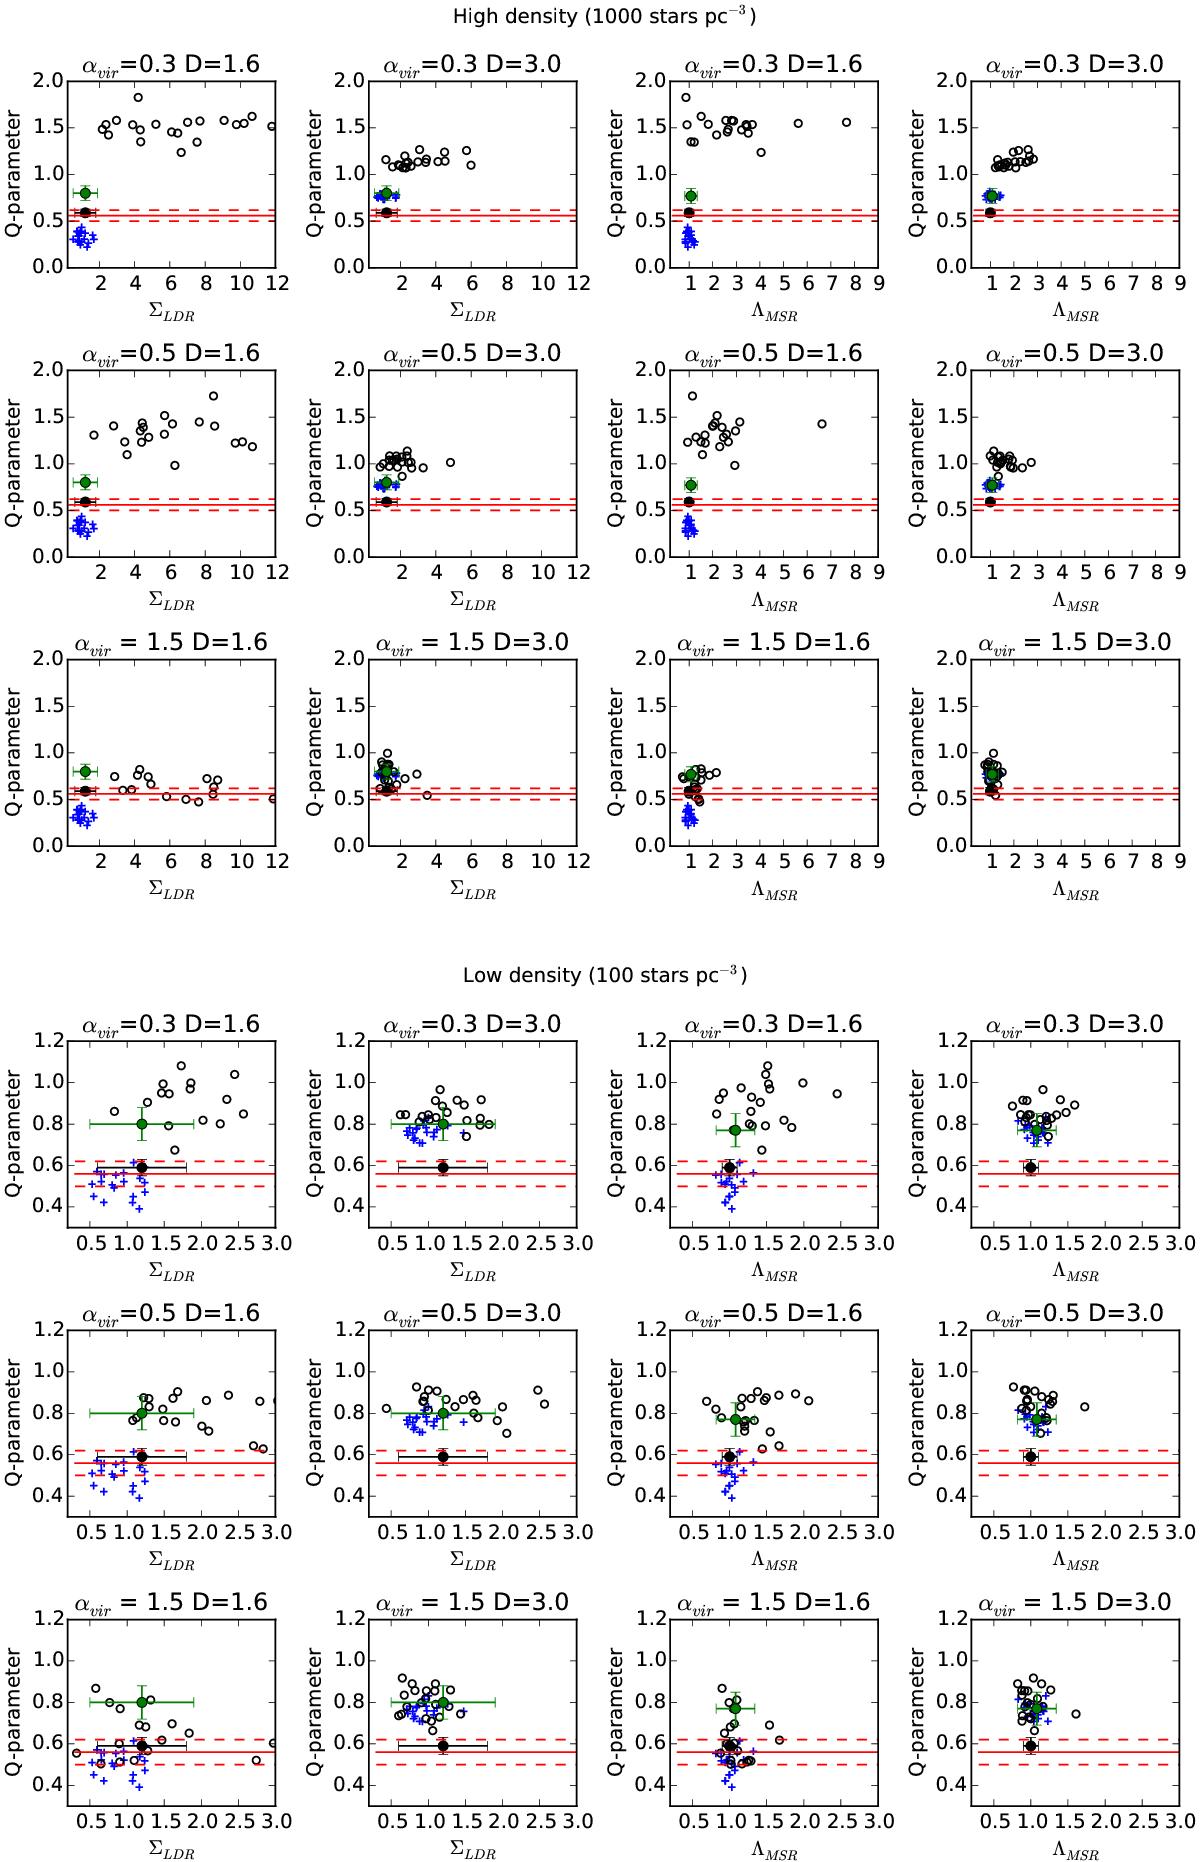
Comparison between the observed structural properties of Cha I and simulated clusters with high (nstars = 1000 stars pc-3, top panels) and low (nstars = 100 stars pc-3, bottom panels) initial stellar density from Parker et al. (2014). The panels on the left and on the right show the Q-parameter as a function of ΣLDR (i.e., the ratio between the median superficial density of the most massive stars and the rest of the sample) and ΛMSR (for the ten most massive stars), respectively. The simulations differ for the initial virial ratio αvir and the initial level of substructure (D = 1.6 is a highly substructured cluster and D = 3.0 is a roughly uniform sphere). Blue crosses and black circles represent the simulated clusters at the initial conditions and after 2 Myr evolution, respectively. Green and black dots represent the properties of Cha I for the full sample of members and only for the stars in the embedded region within the smallest ellipse in Fig. 6, respectively. The red lines trace the Q-parameter estimated for the pre-stellar cores with errors.
Current usage metrics show cumulative count of Article Views (full-text article views including HTML views, PDF and ePub downloads, according to the available data) and Abstracts Views on Vision4Press platform.
Data correspond to usage on the plateform after 2015. The current usage metrics is available 48-96 hours after online publication and is updated daily on week days.
Initial download of the metrics may take a while.