Free Access
Fig. 10
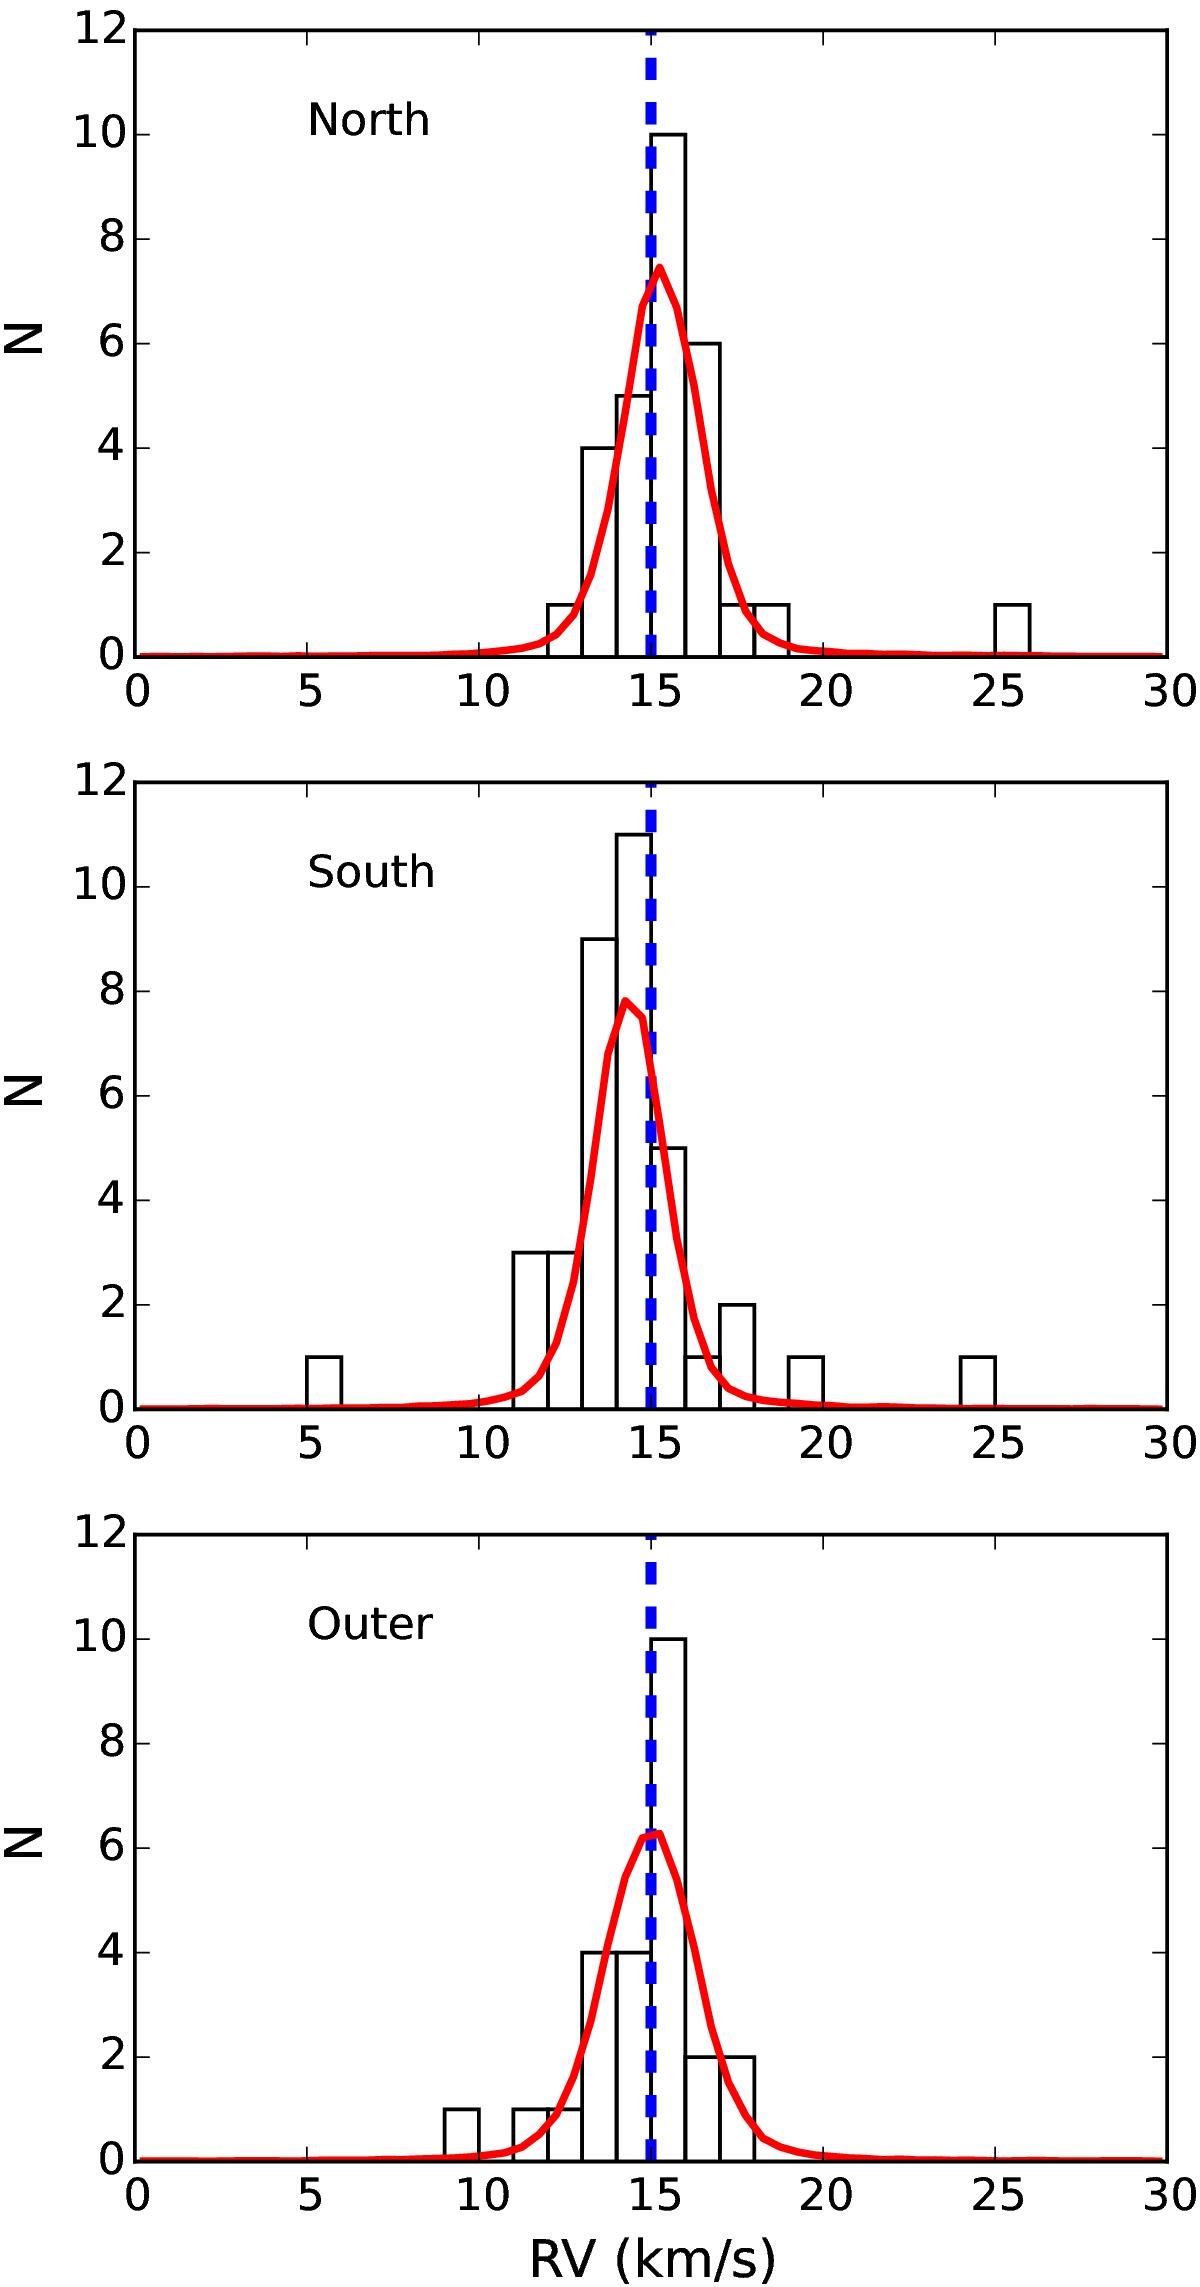
From top to bottom: RV distributions of the north subcluster, the south subcluster, and the stars dispersed in the outer regions. The dashed blue line marks the velocity of 15 km s-1 and the red line is the best-fit distribution with the same model used for the full sample.
Current usage metrics show cumulative count of Article Views (full-text article views including HTML views, PDF and ePub downloads, according to the available data) and Abstracts Views on Vision4Press platform.
Data correspond to usage on the plateform after 2015. The current usage metrics is available 48-96 hours after online publication and is updated daily on week days.
Initial download of the metrics may take a while.