Fig. 7
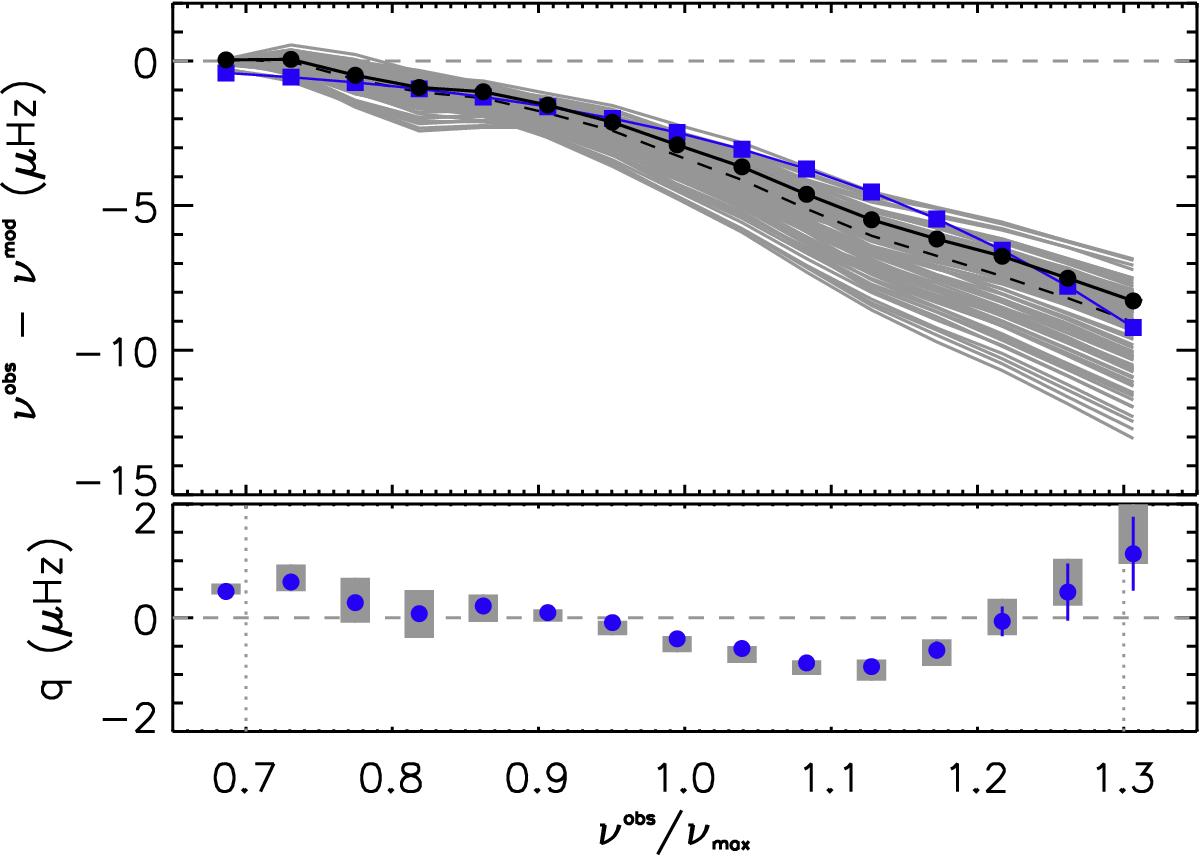
Top: surface term for the reference solar model (connected black dots) for the l = 0 frequencies as a function of observed frequency scaled by νmax. The surface term for a sample of 100 of the best models is also shown for the Sun (gray), with the mean value highlighted by the dashed line. The blue connected squares show the empirical surface correction δνn,l (Eq. (7)) based on the reference model. Lower: the differences between the observed and corrected model frequencies as a function of scaled frequency, with the solar observational errors overplotted in blue. The shaded gray areas represent the mean and standard deviation of q for the same 100 models shown in the top panel. The dotted vertical lines delimit the region used to calculate the quality metric Q.
Current usage metrics show cumulative count of Article Views (full-text article views including HTML views, PDF and ePub downloads, according to the available data) and Abstracts Views on Vision4Press platform.
Data correspond to usage on the plateform after 2015. The current usage metrics is available 48-96 hours after online publication and is updated daily on week days.
Initial download of the metrics may take a while.