Fig. 2
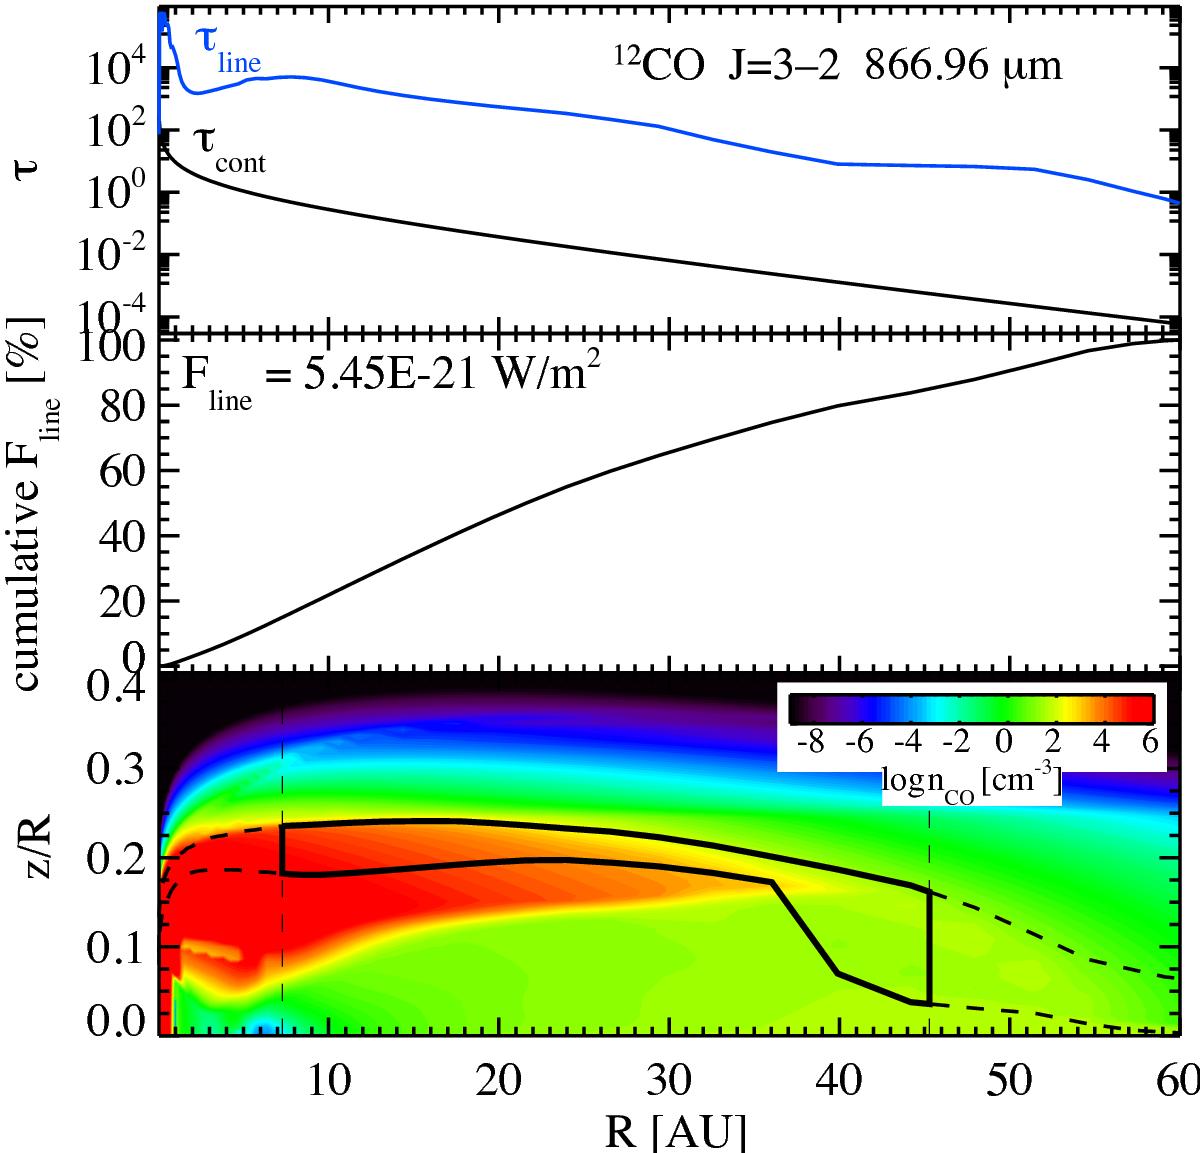
Analysis of the 12CO J = 3−2 line in the fiducial model. As seen in the top panel, most of the line emission remains optically thick. The middle panel shows the cumulative line flux at each radius. In the lower panel, the area enclosed by the black curve shows where 70% of the flux originates from in both the radial and vertical directions (hence, the enclosed area contains 70% × 70% = 49% of the total line flux). The x-axis boundaries of this area are created first, as the radii within which 15% and 85% of the radially-cumulative line flux originates. Then the y-axis boundaries of this area are taken as the disc heights (z/R), where within each radial sector 15% and 85% of the vertically-integrated line flux originates.
Current usage metrics show cumulative count of Article Views (full-text article views including HTML views, PDF and ePub downloads, according to the available data) and Abstracts Views on Vision4Press platform.
Data correspond to usage on the plateform after 2015. The current usage metrics is available 48-96 hours after online publication and is updated daily on week days.
Initial download of the metrics may take a while.