Fig. 2
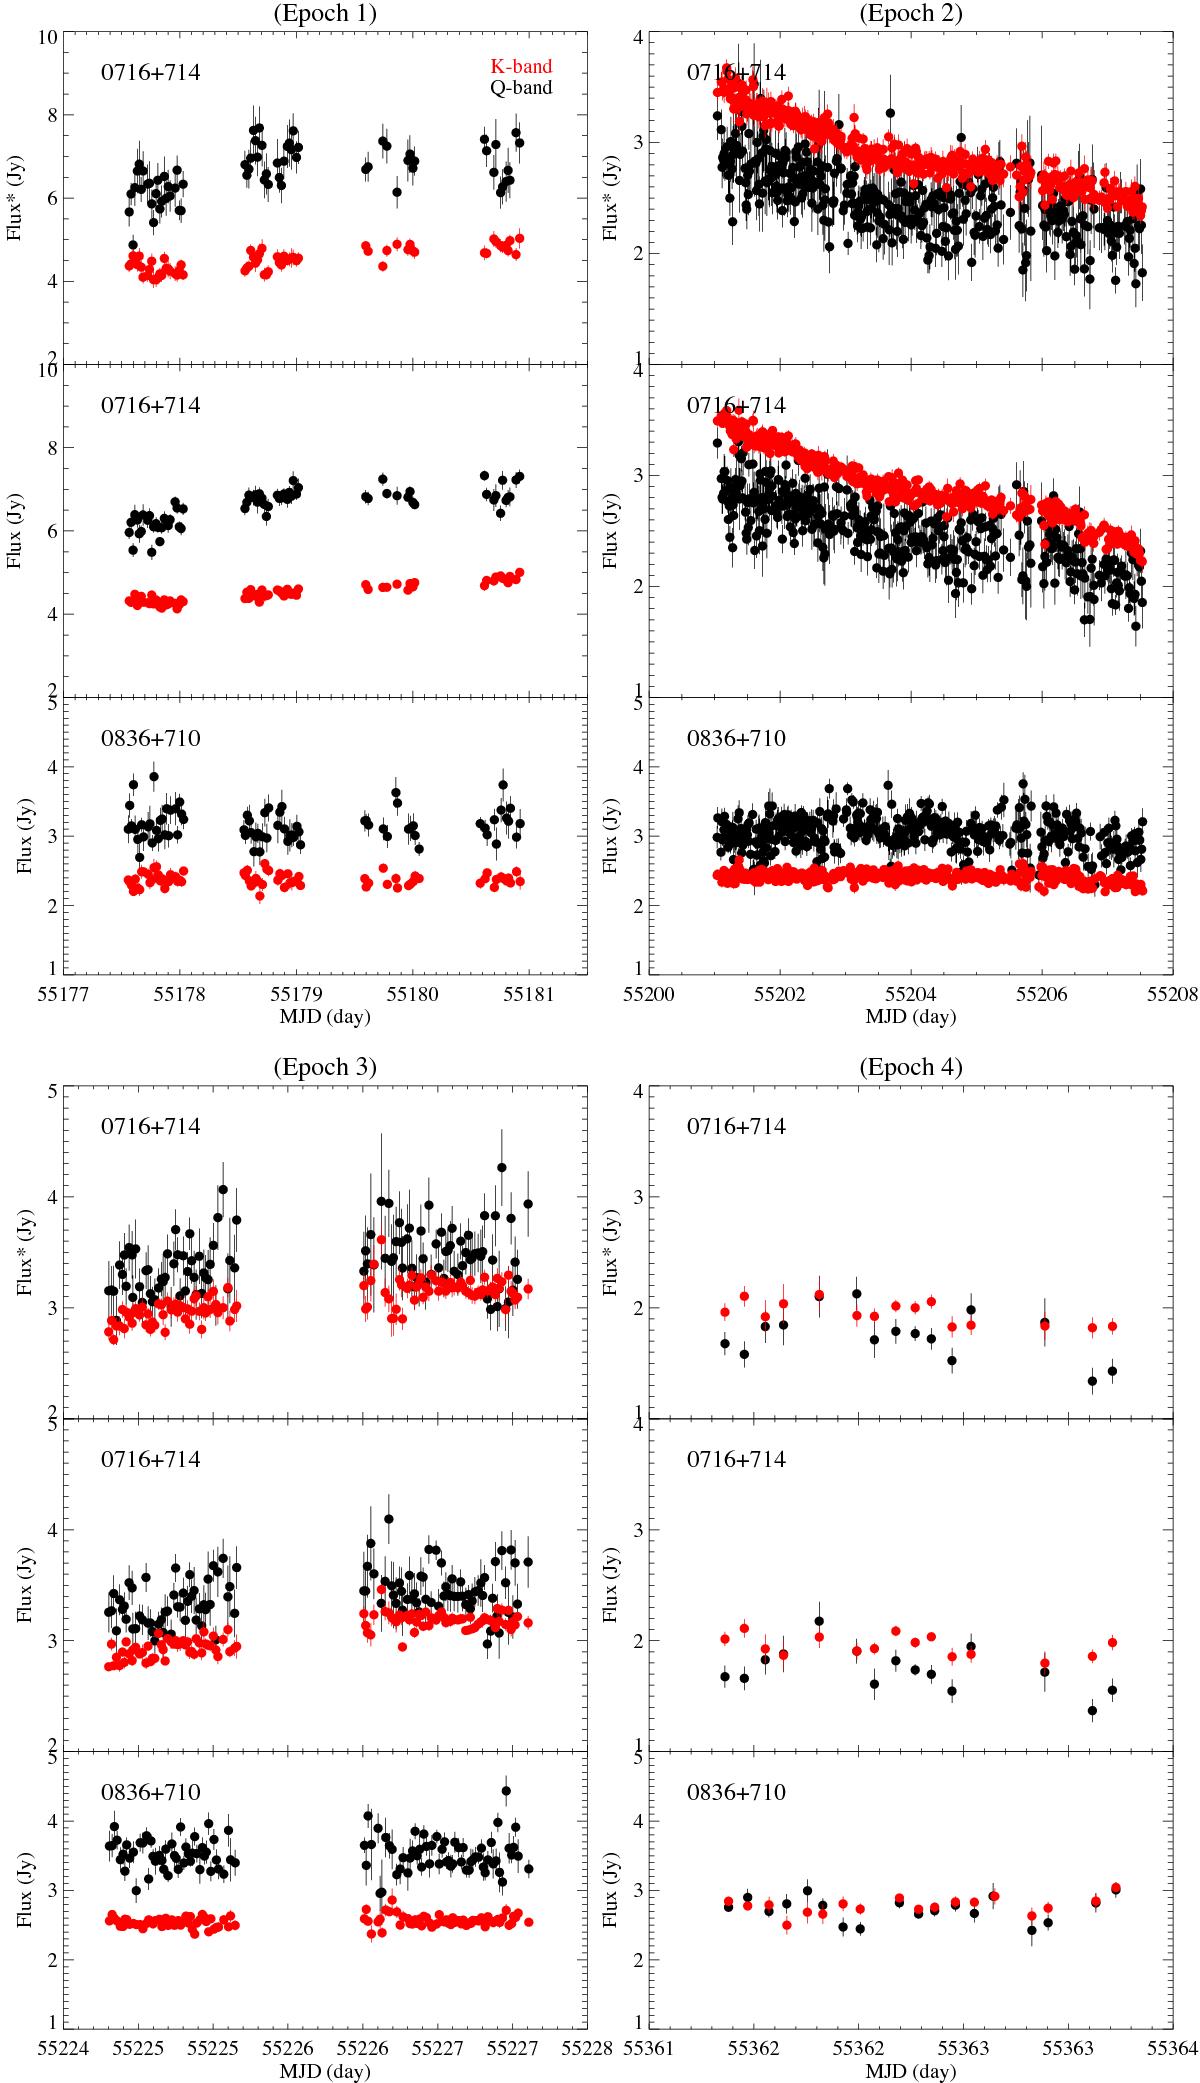
Light curves of S5 0716+714 (top and middle panels) and of the secondary calibrator, 0836+710, (bottom panel) obtained from multi-epoch observations at the K-band and the Q-band simultaneously. In the middle panel of each epoch, the flux densities of S5 0716+714 correspond to the flux densities without the calibration, with relative gain of 0836+710. The top panel represents the finally-calibrated flux densities of S5 0716+714. Red and black symbols indicate the K-band and the Q-band, respectively. Here, the error bars indicate 1σ measurement error.
Current usage metrics show cumulative count of Article Views (full-text article views including HTML views, PDF and ePub downloads, according to the available data) and Abstracts Views on Vision4Press platform.
Data correspond to usage on the plateform after 2015. The current usage metrics is available 48-96 hours after online publication and is updated daily on week days.
Initial download of the metrics may take a while.