Free Access
Fig. 4
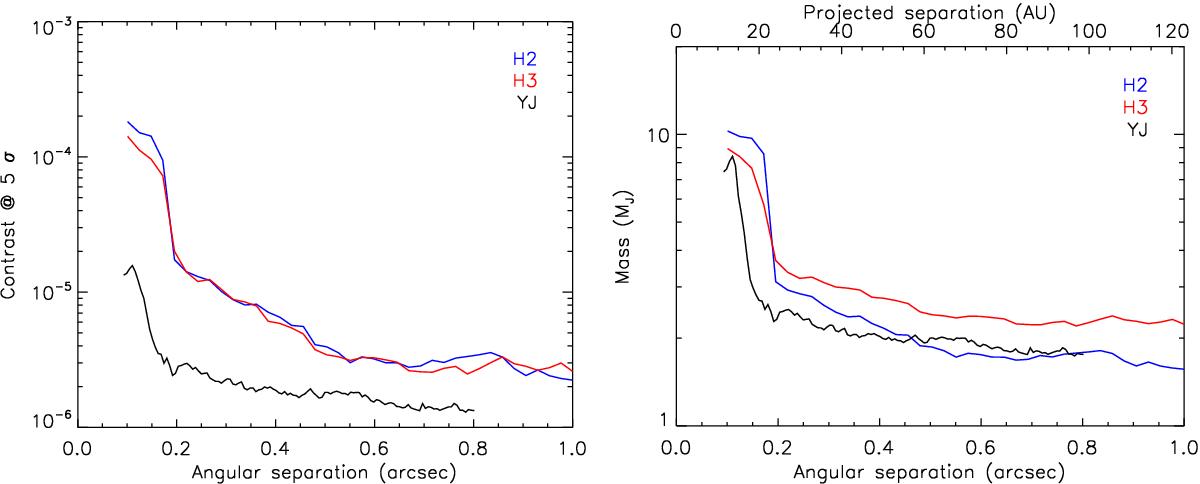
Contrast achieved in the companion search with IRDIS (H2 and H3) and IFS (YJ) using the TLOCI algorithm. The ADI contrast limits from the left figure have been converted to mass limits on the right using models from Baraffe et al. (2015) computed specifically for the SPHERE spectral bands and an age of 10 Myr.
This figure is made of several images, please see below:
Current usage metrics show cumulative count of Article Views (full-text article views including HTML views, PDF and ePub downloads, according to the available data) and Abstracts Views on Vision4Press platform.
Data correspond to usage on the plateform after 2015. The current usage metrics is available 48-96 hours after online publication and is updated daily on week days.
Initial download of the metrics may take a while.