Fig. 3

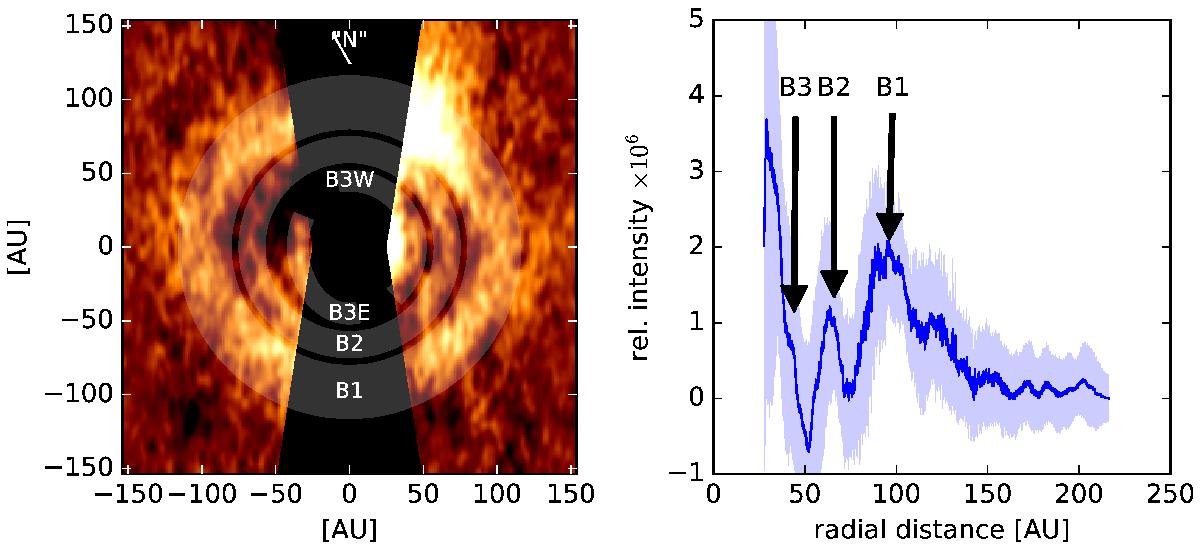
Structures detected in the disk of HIP 73145. Left: deprojected version of the image shown in Fig. 1 (see Text). The features under discussion are denoted with semi-transparent rings and labeled B1, B2, B3E, and B3W. The black mask covers the area that is too close to the coronagraph and the large negative ADI artifacts. Right: intensity of all pixels in the image to the left plotted versus their radial separation from the center. The dark blue line is formed by applying a 100 point wide running mean to all pixel intensities after sorting according to their distance to the center. The light-blue shaded area represents the standard deviation across 100 neighboring points at each separation. The two major features B1 and B2 are easily identified. The B3 feature is less obvious, as it is close to the inner edge of the usable area and not circular.
Current usage metrics show cumulative count of Article Views (full-text article views including HTML views, PDF and ePub downloads, according to the available data) and Abstracts Views on Vision4Press platform.
Data correspond to usage on the plateform after 2015. The current usage metrics is available 48-96 hours after online publication and is updated daily on week days.
Initial download of the metrics may take a while.


