Free Access
Fig. 10
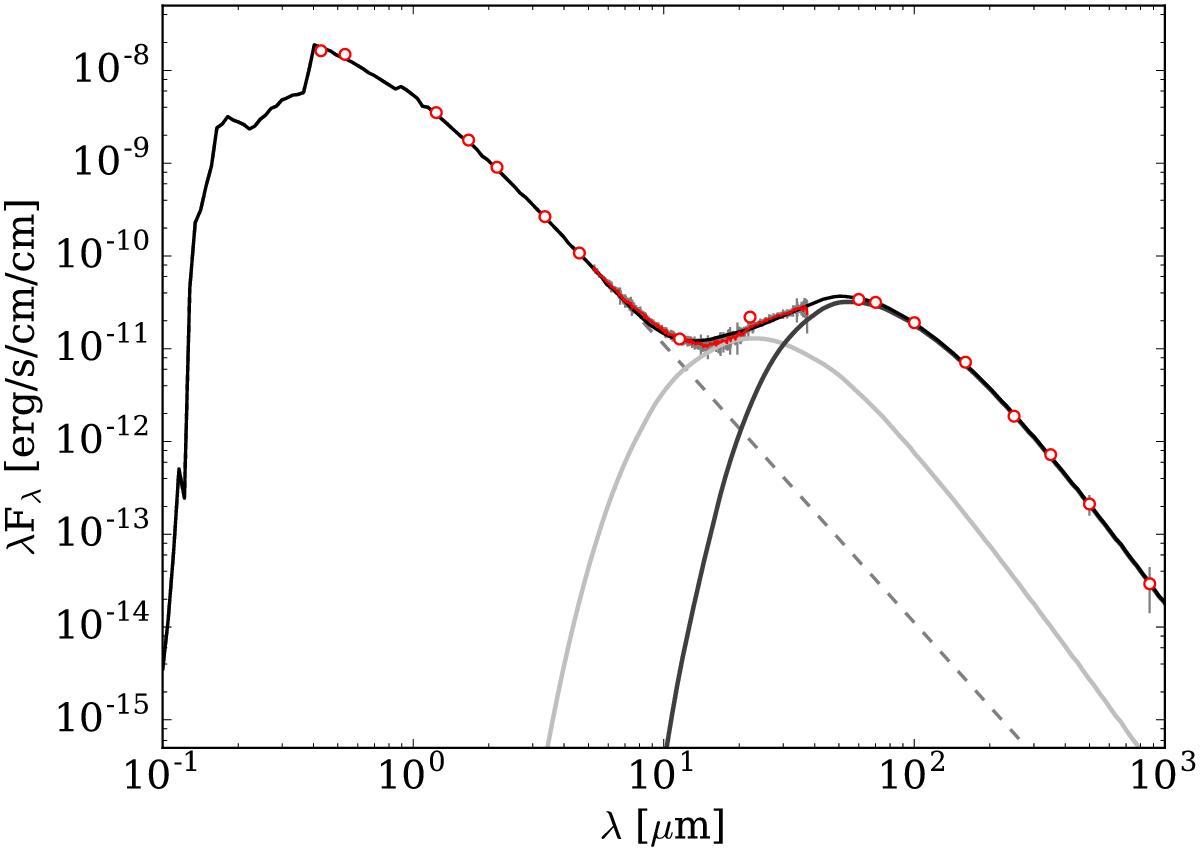
Debris disk SED around HIP 73145. Observations are shown in red; the photospheric model is shown with a dashed gray line. The emission profiles of the inner and outer belts are shown in light and dark gray lines, respectively, while the total fit (including the stellar contribution) is indicated in solid black.
Current usage metrics show cumulative count of Article Views (full-text article views including HTML views, PDF and ePub downloads, according to the available data) and Abstracts Views on Vision4Press platform.
Data correspond to usage on the plateform after 2015. The current usage metrics is available 48-96 hours after online publication and is updated daily on week days.
Initial download of the metrics may take a while.