Fig. 2
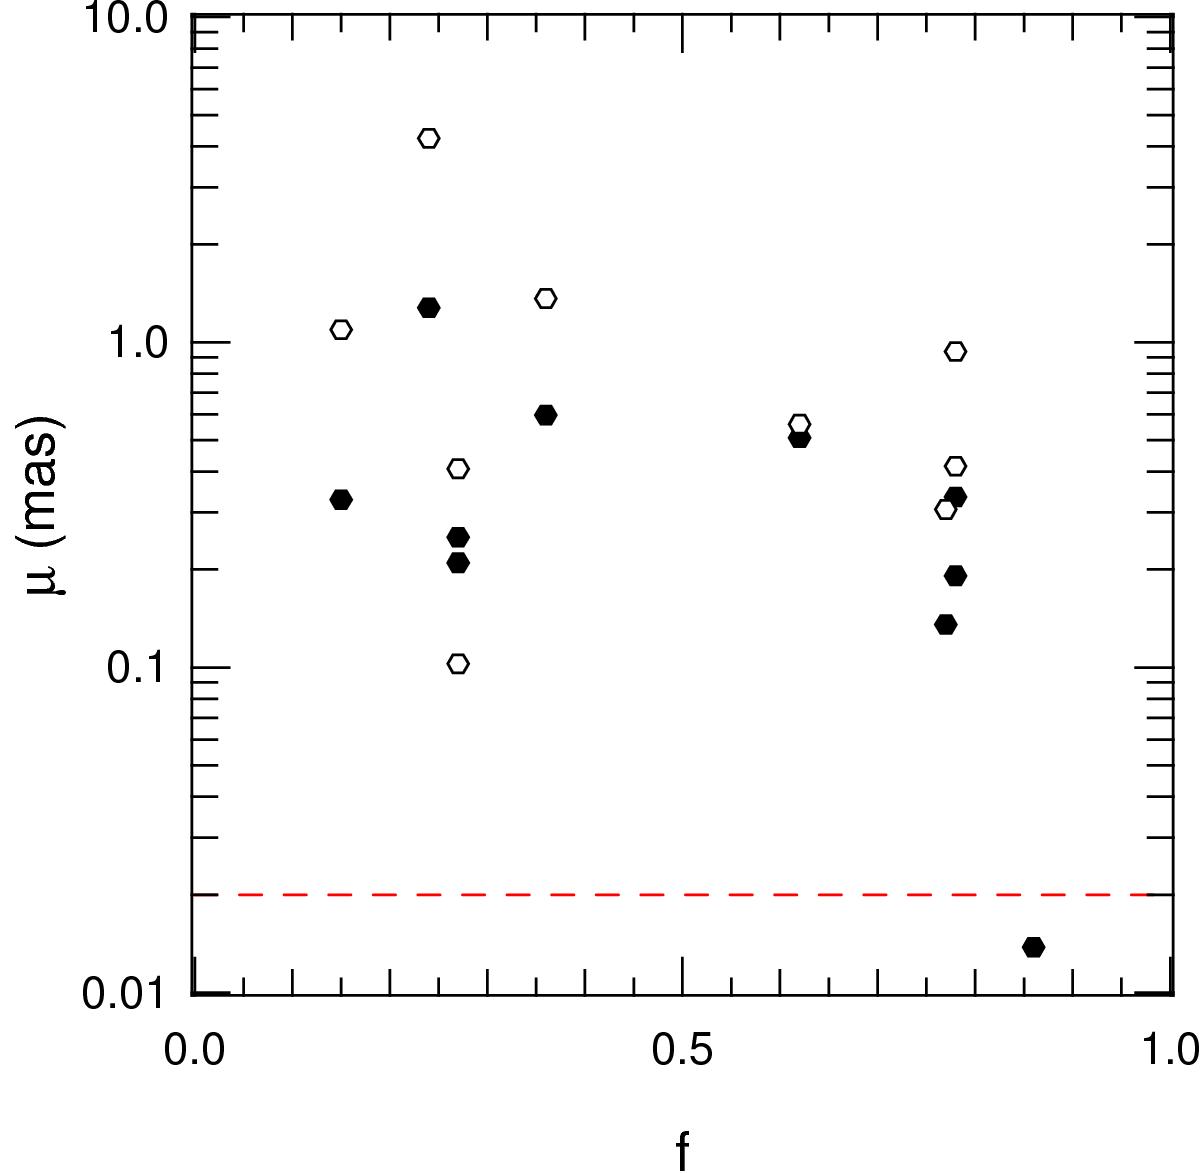
Predicted photocentre displacement versus the flux ratio for the ten binaries of the sample. The mass ratios were estimated either from the flux ratio (assuming main sequence stars, filled symbols), or derived from the individual spectral types when available (open symbols). The dashed red line is for the expected Gaia performances.
Current usage metrics show cumulative count of Article Views (full-text article views including HTML views, PDF and ePub downloads, according to the available data) and Abstracts Views on Vision4Press platform.
Data correspond to usage on the plateform after 2015. The current usage metrics is available 48-96 hours after online publication and is updated daily on week days.
Initial download of the metrics may take a while.