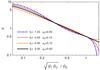
Fig. 8
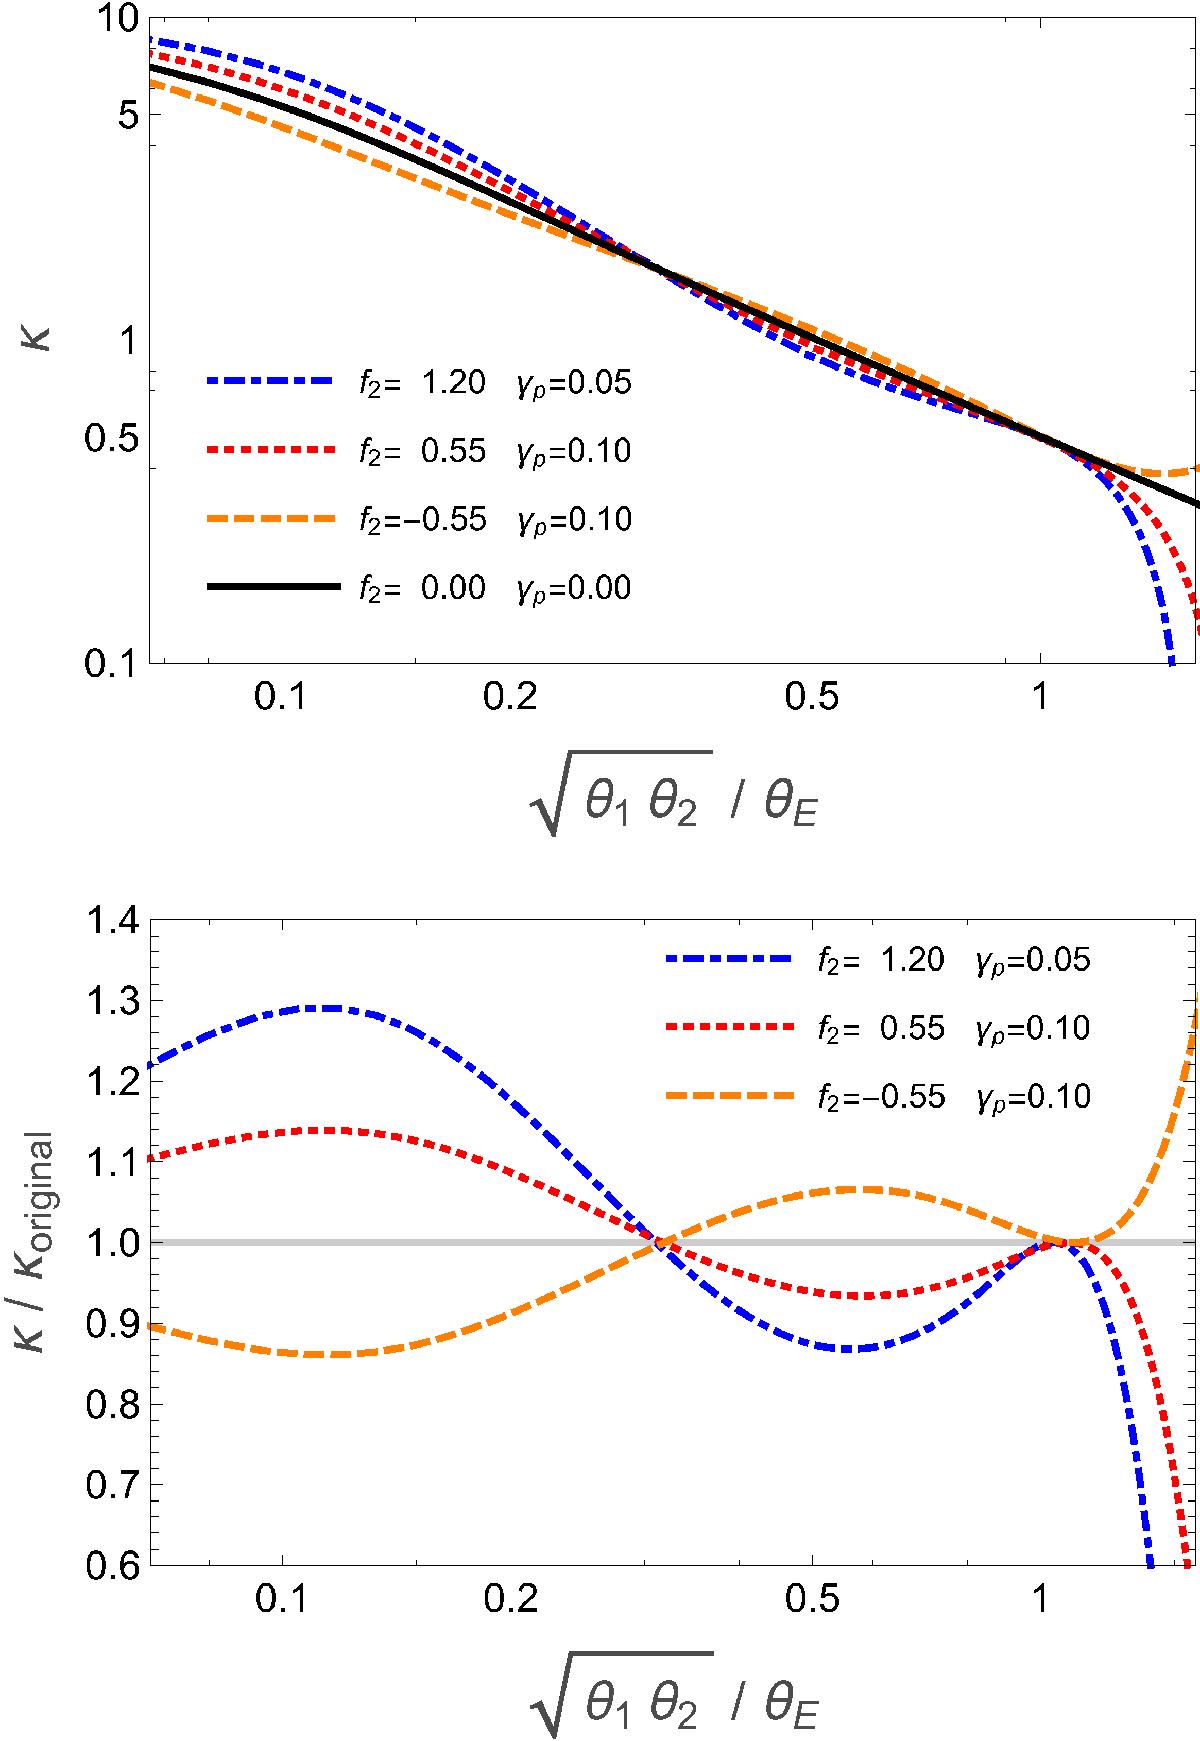
Upper panel shows the mass profile of the original NIS lens (solid curve), and that of three SPT-transformed lenses, with parameters f2 and γp indicated by the labels. For all of these three models, Δαmax ≈ εacc = 5 × 10⁻³θE. Since the transformed mass distributions have a finite ellipticity, the density is plotted as a function of the geometric mean of the major and minor semi-axis of the best-fitting ellipse to an isodensity contour, except for the case with negative f2, for which the outer isodensity contours are not closing around the lens center; in this special case, the x-axis corresponds to the θ1-axis. The convergence changes up to 28% for radii smaller than 1 θE, radii larger than that show a significantly smaller convergence for a positive f2. Negative f2 show an essentially mirrored behavior compared to positive f2. This leads to convergence ![]() that may not decrease monotonically. The lower panel shows the ratio between transformed and original mass profile.
that may not decrease monotonically. The lower panel shows the ratio between transformed and original mass profile.
Current usage metrics show cumulative count of Article Views (full-text article views including HTML views, PDF and ePub downloads, according to the available data) and Abstracts Views on Vision4Press platform.
Data correspond to usage on the plateform after 2015. The current usage metrics is available 48-96 hours after online publication and is updated daily on week days.
Initial download of the metrics may take a while.