Fig. 3
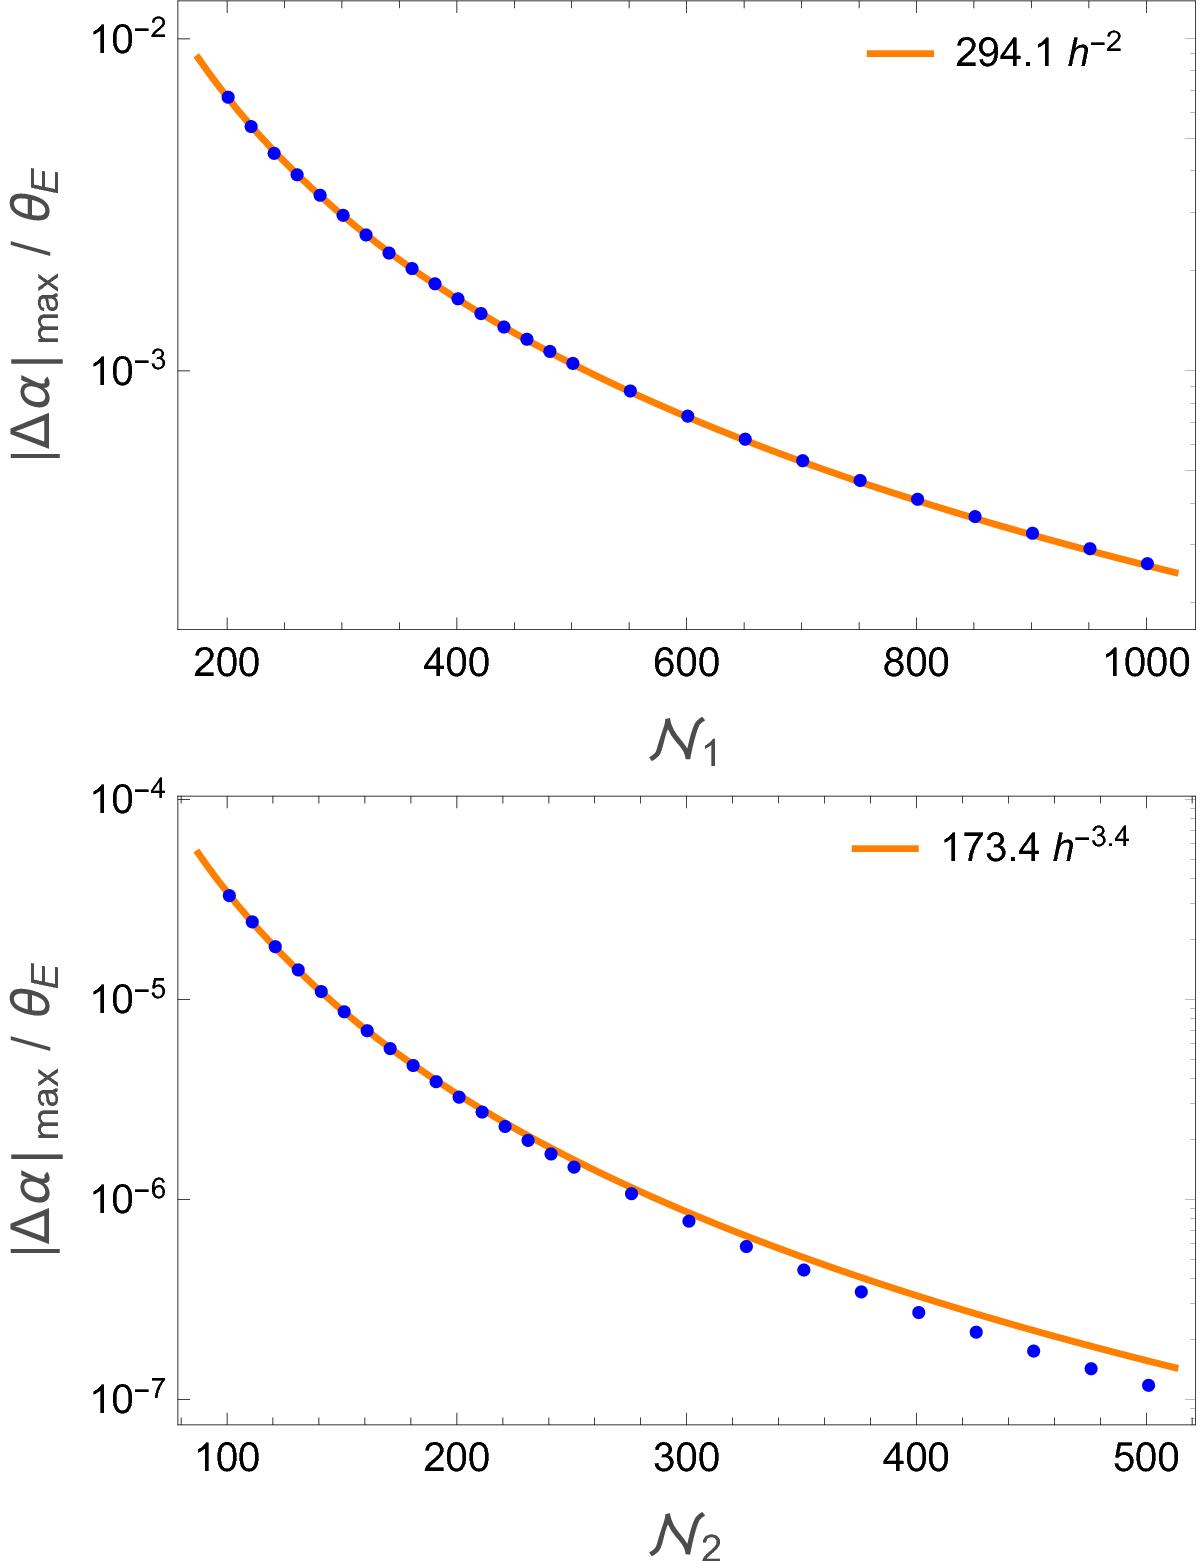
Maximum difference of ![]() for a non-singular isothermal sphere with core radius θc = 0.1 θE as a function of the number of grid points number
for a non-singular isothermal sphere with core radius θc = 0.1 θE as a function of the number of grid points number ![]() used in the numerical solution. Blue dots are the numerical results, whereas the curves present power-law fits to these points with h being the spacing of grid points. In the top panel, the results are shown for the “standard” method, where the numerical error scales as
used in the numerical solution. Blue dots are the numerical results, whereas the curves present power-law fits to these points with h being the spacing of grid points. In the top panel, the results are shown for the “standard” method, where the numerical error scales as ![]() . Incorporating the extrapolation scheme, the numerical error decreases much faster with the number of grid point, as can be seen in the lower panel (note the different scale for the y-axis in the upper and lower panel). For the typical values used in the papers (
. Incorporating the extrapolation scheme, the numerical error decreases much faster with the number of grid point, as can be seen in the lower panel (note the different scale for the y-axis in the upper and lower panel). For the typical values used in the papers (![]() ), a gain in accuracy by three orders of magnitude is obtained with extrapolation with only a modest increase of computational cost (~ 25%). Since extrapolation includes calculating
), a gain in accuracy by three orders of magnitude is obtained with extrapolation with only a modest increase of computational cost (~ 25%). Since extrapolation includes calculating ![]() twice with grid points 2N and N, values are only shown up to
twice with grid points 2N and N, values are only shown up to ![]() which correspond to
which correspond to ![]() in the graph above.
in the graph above.
Current usage metrics show cumulative count of Article Views (full-text article views including HTML views, PDF and ePub downloads, according to the available data) and Abstracts Views on Vision4Press platform.
Data correspond to usage on the plateform after 2015. The current usage metrics is available 48-96 hours after online publication and is updated daily on week days.
Initial download of the metrics may take a while.