Fig. 14
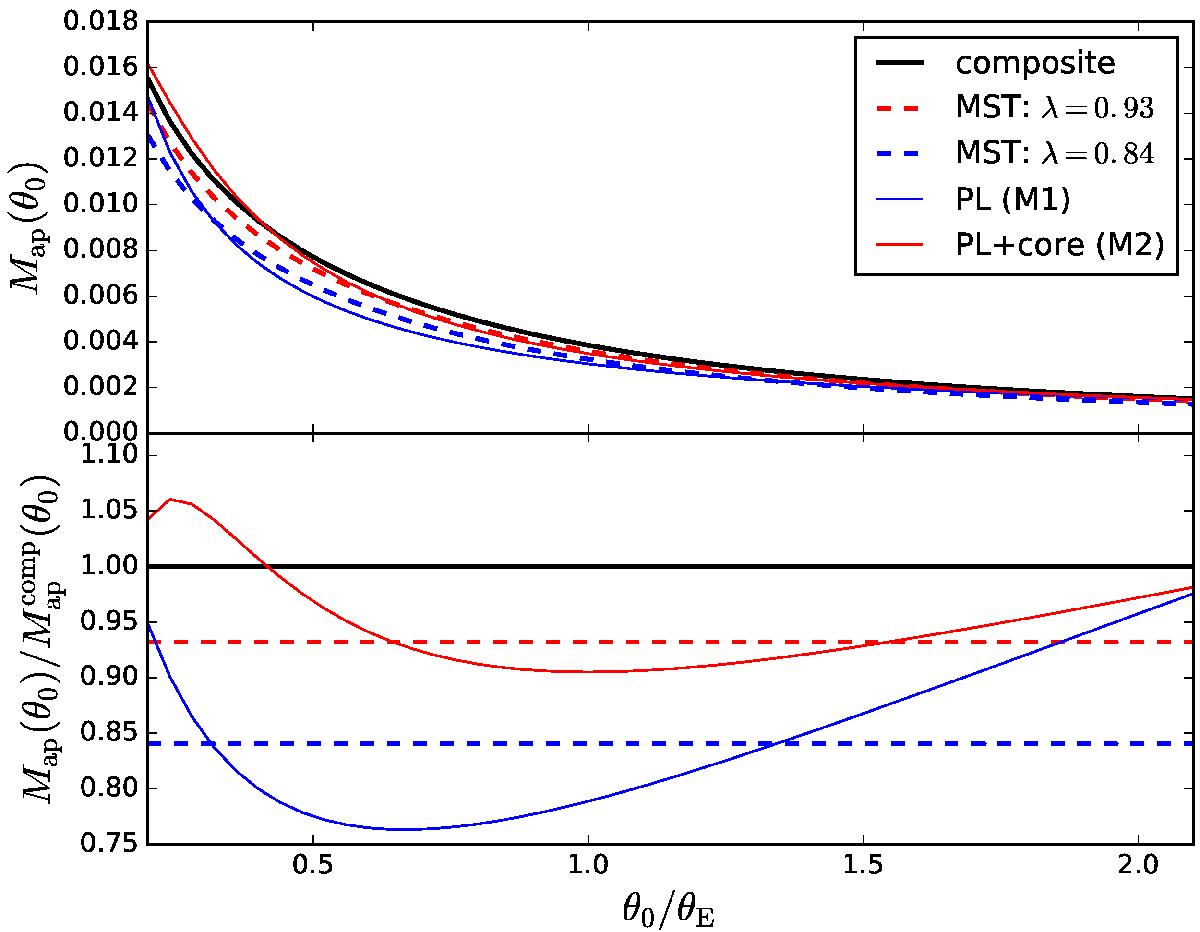
Top: Map(θ0) (Eq. (34)) as a function of θ0, for the composite Hernquist+gNFW model (black), for the power law model M1 (blue), and the cored power-law M2 (red). Dashed red (blue) profile shows Map(θ0) for an MST transformed version of the composite model with λ = 0.93 (resp. 0.84). Bottom: ratio of Map(θ0) between the “transformed” models and the composite. The dashed curves correspond to MST-transformed versions of the composite model, and represent the contribution of the MST to M1 and M2. The solid red and blue curves suggest that the remaining of the degeneracy can be associated with an SPT.
Current usage metrics show cumulative count of Article Views (full-text article views including HTML views, PDF and ePub downloads, according to the available data) and Abstracts Views on Vision4Press platform.
Data correspond to usage on the plateform after 2015. The current usage metrics is available 48-96 hours after online publication and is updated daily on week days.
Initial download of the metrics may take a while.