Fig. 11
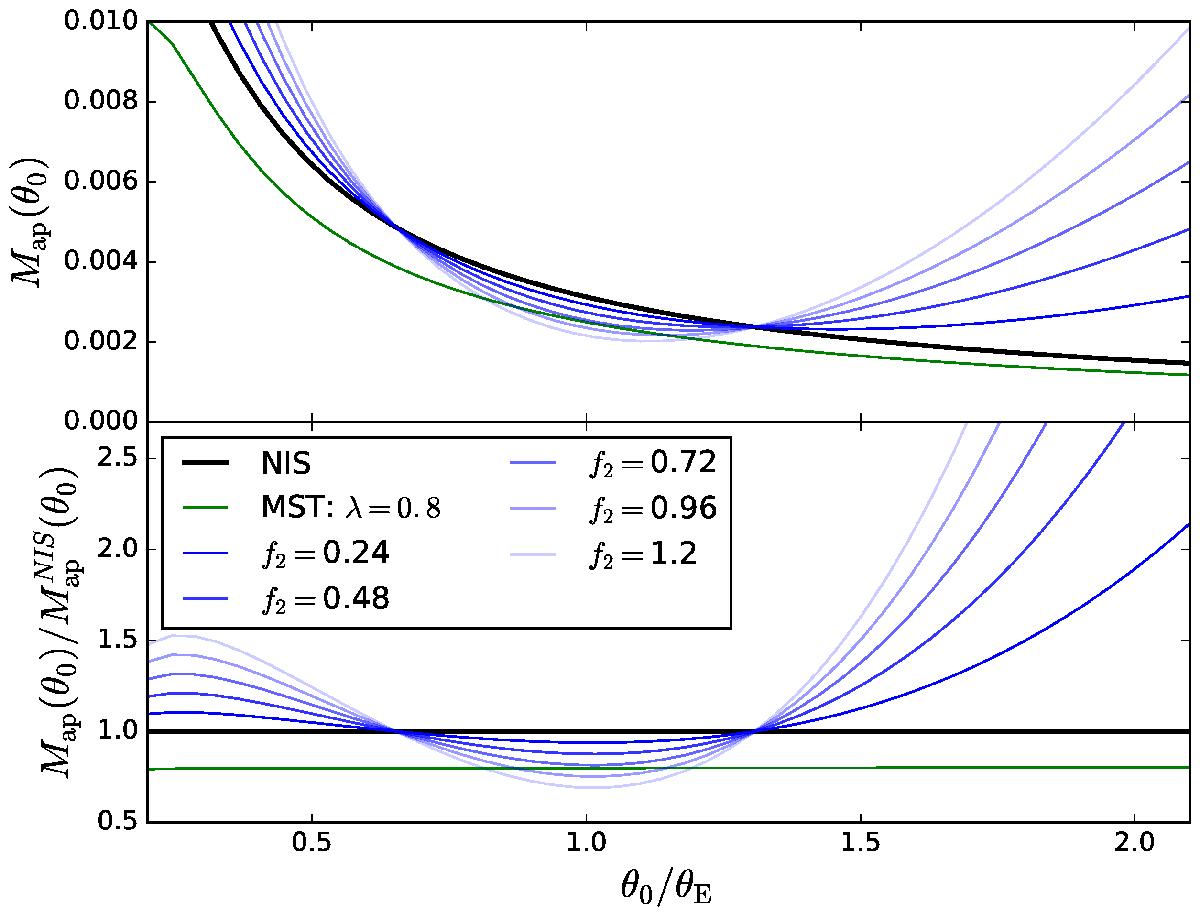
Top: Map(θ0) (Eq. (34)) as a function of the “aperture” θ0. The filter function u(x) defined by Eq. (38), using x0 = 0.5, has been used such that for Map(θ0), the annulus [θ0/ (2θE),θ0/θE] is probed. The black curve shows Map for the NIS profile and the blue curves for the SPT-transformed profiles with γp = 0.05 and various values of f2. The green curve shows Map(θ0) for an MST transformed version of the NIS profile. Bottom: ratio between Map derived for the various transformed profiles and for the original NIS profile.
Current usage metrics show cumulative count of Article Views (full-text article views including HTML views, PDF and ePub downloads, according to the available data) and Abstracts Views on Vision4Press platform.
Data correspond to usage on the plateform after 2015. The current usage metrics is available 48-96 hours after online publication and is updated daily on week days.
Initial download of the metrics may take a while.