Fig. 10
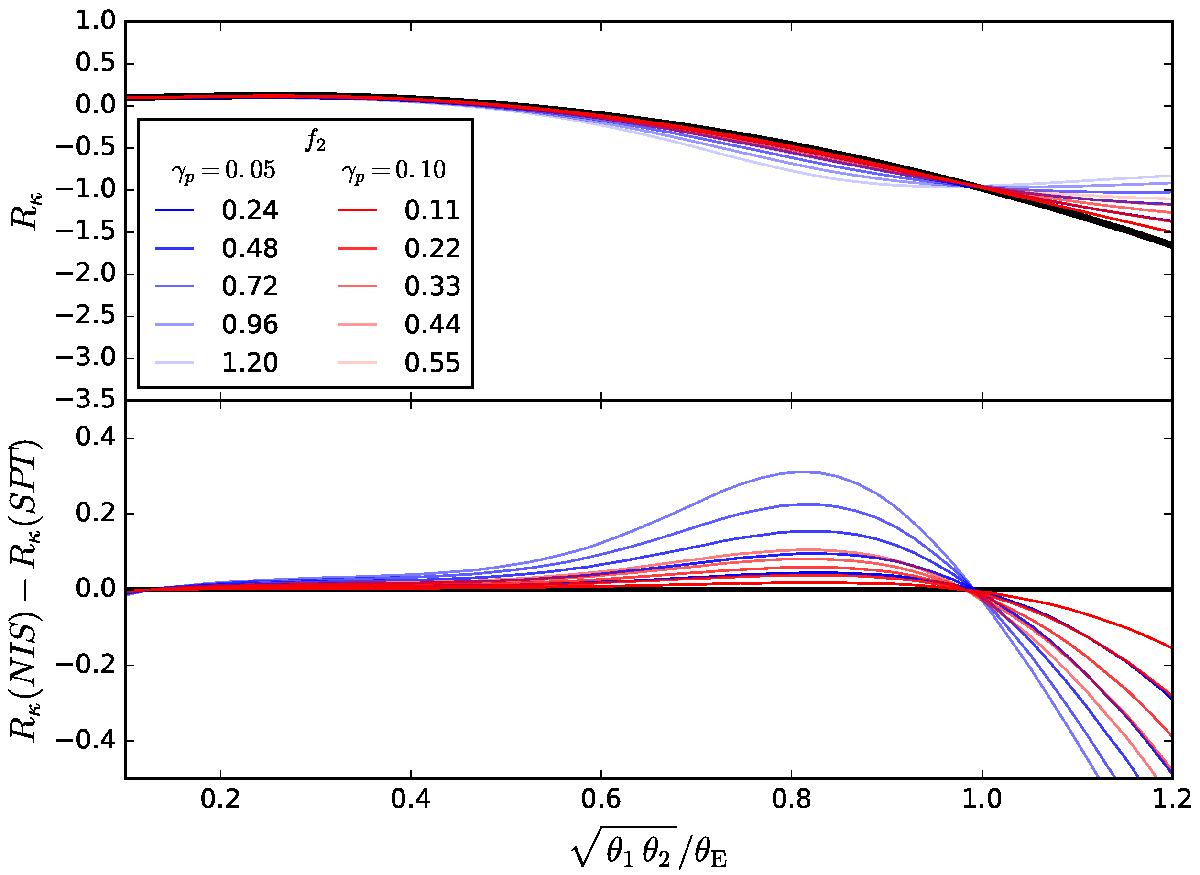
Top: quantity Rκ(θ) (Eq. (33)) calculated for an NIS with external shear γp (cf. Sect. 4; solid black) and for various SPT-transformed models with SPT of the form 1 + f2/ 2 (β/θE)2 (Eq. (28)). The range of positive values of f2 allowed by | Δ αmax | < 5 × 10⁻³θE (Fig. 4) is explored for two different choices of the shear: γp = 0.05 (blue) and γp = 0.1 (red). While Rκ is conserved under an MST, it is not under an SPT, with deviation that can reach tens of percents. Bottom: for each curve of the top panel, we show the difference between Rκ of the original NIS model and of the SPT transformed model.
Current usage metrics show cumulative count of Article Views (full-text article views including HTML views, PDF and ePub downloads, according to the available data) and Abstracts Views on Vision4Press platform.
Data correspond to usage on the plateform after 2015. The current usage metrics is available 48-96 hours after online publication and is updated daily on week days.
Initial download of the metrics may take a while.