Fig. 9
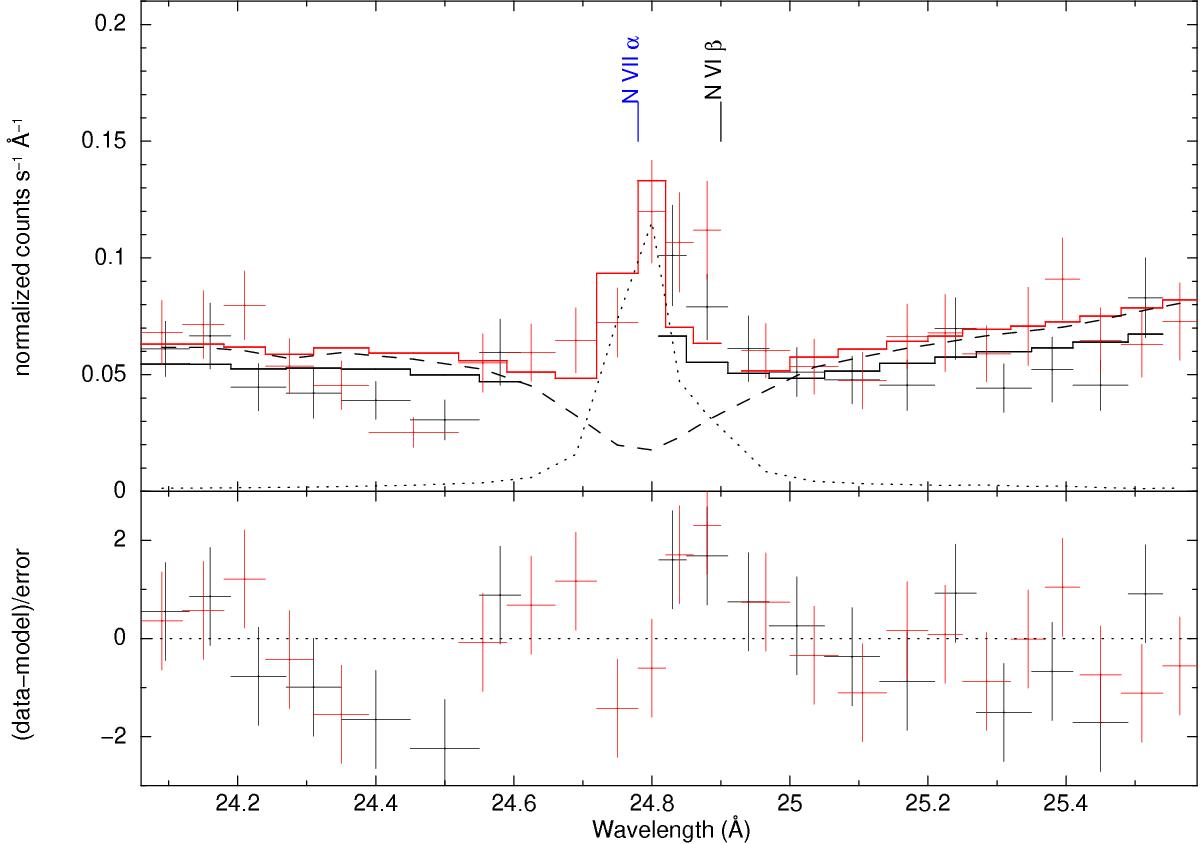
Detail of the RGS1 (black) and RGS2 (red) spectra in low-flux state around the N VII α absorption line, modeled by the TMAP atmosphere model 008 (dashed curve). The excess in the data left by the atmosphere model could be due either to N VI β line blueshifted by ~1300 km s-1, or to N VII α line redshifted by around ~500 km s-1.
Current usage metrics show cumulative count of Article Views (full-text article views including HTML views, PDF and ePub downloads, according to the available data) and Abstracts Views on Vision4Press platform.
Data correspond to usage on the plateform after 2015. The current usage metrics is available 48-96 hours after online publication and is updated daily on week days.
Initial download of the metrics may take a while.