Free Access
Fig. 3
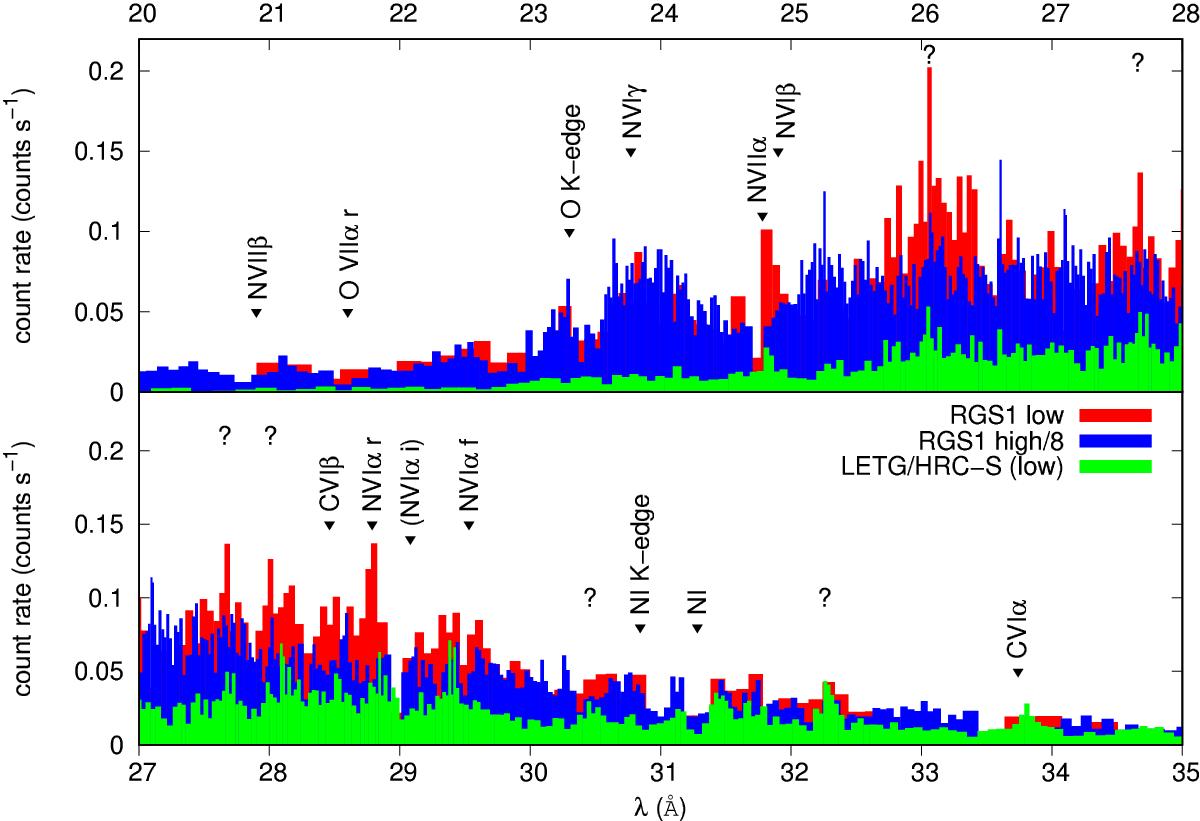
XMM-Newton/RGS1 spectra of V5116 Sgr in high (blue) and low (red) flux periods in March 2007, and Chandra LETG/HRC-S excluding the flares (green), obtained in August 2007. The count-rate of the high-flux period of the RGS1 data has been downscaled by a factor of eight for ease of comparison.
Current usage metrics show cumulative count of Article Views (full-text article views including HTML views, PDF and ePub downloads, according to the available data) and Abstracts Views on Vision4Press platform.
Data correspond to usage on the plateform after 2015. The current usage metrics is available 48-96 hours after online publication and is updated daily on week days.
Initial download of the metrics may take a while.