Free Access
Fig. 2
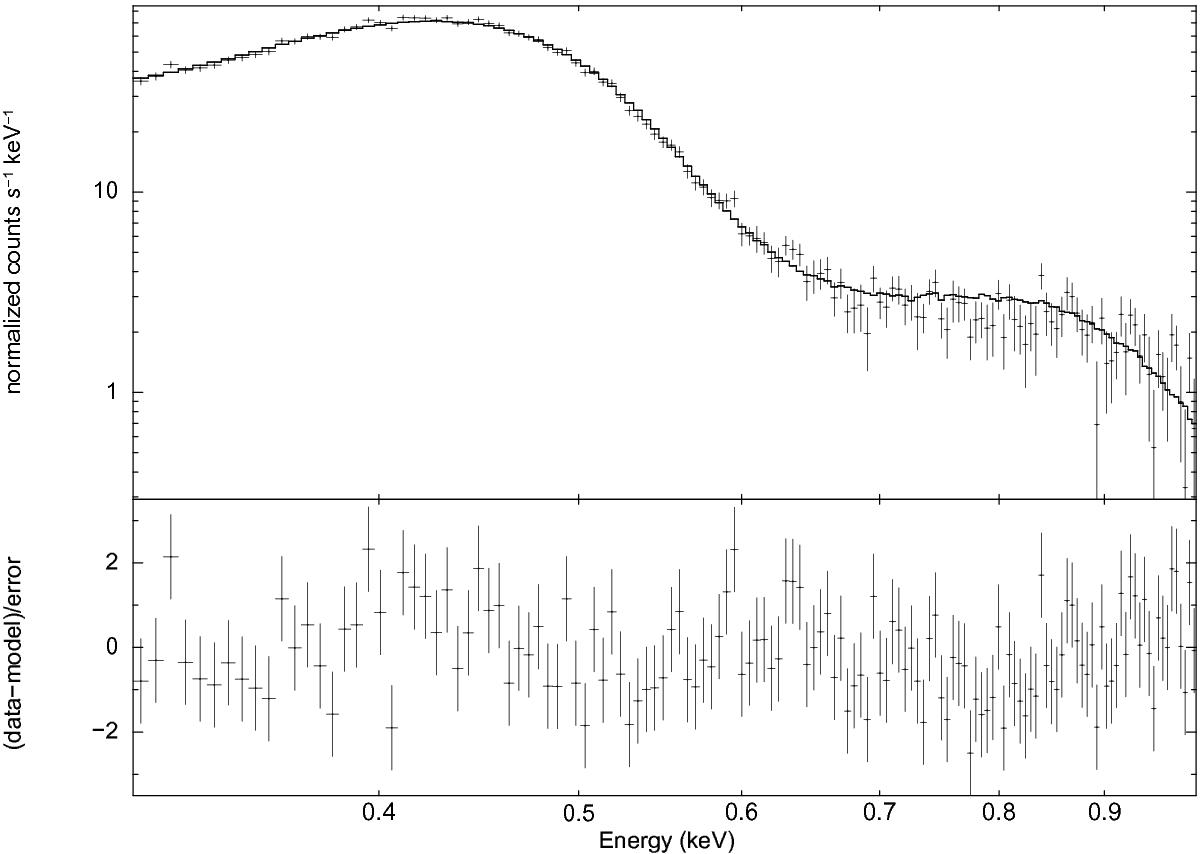
EPIC-pn spectrum of V5116 Sgr during low-flux periods in March 2007, fit with an absorbed blackbody. Pile-up correction is applied to the response matrix and can be seen by good reproduction of the emission above 0.7 keV by the model.
Current usage metrics show cumulative count of Article Views (full-text article views including HTML views, PDF and ePub downloads, according to the available data) and Abstracts Views on Vision4Press platform.
Data correspond to usage on the plateform after 2015. The current usage metrics is available 48-96 hours after online publication and is updated daily on week days.
Initial download of the metrics may take a while.