Fig. 14
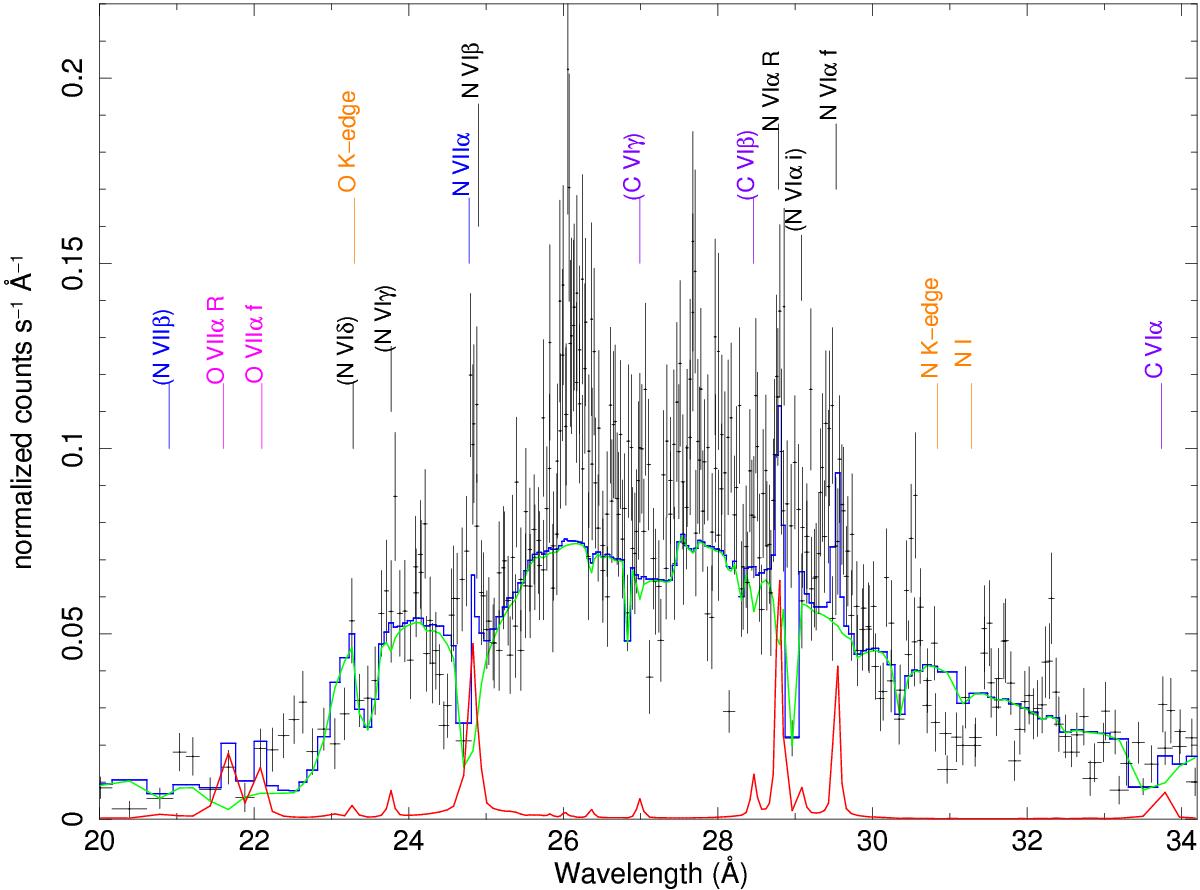
RGS1/2 spectrum during the low-flux state (black), fit with the TBabs, TMAF atmosphere model 003 (green), and VAPEC plasma model (red) with free C, N and O abundances. The total model is shown in blue. Best fits are obtained with normalization of the atmosphere about a factor of eight fainter than in high-flux, an atmosphere temperature around 7 × 10⁵ K, a plasma temperature around 0.1 keV, and poorly constrained but high overabundances of [C], [N], and [O].
Current usage metrics show cumulative count of Article Views (full-text article views including HTML views, PDF and ePub downloads, according to the available data) and Abstracts Views on Vision4Press platform.
Data correspond to usage on the plateform after 2015. The current usage metrics is available 48-96 hours after online publication and is updated daily on week days.
Initial download of the metrics may take a while.