Fig. 11
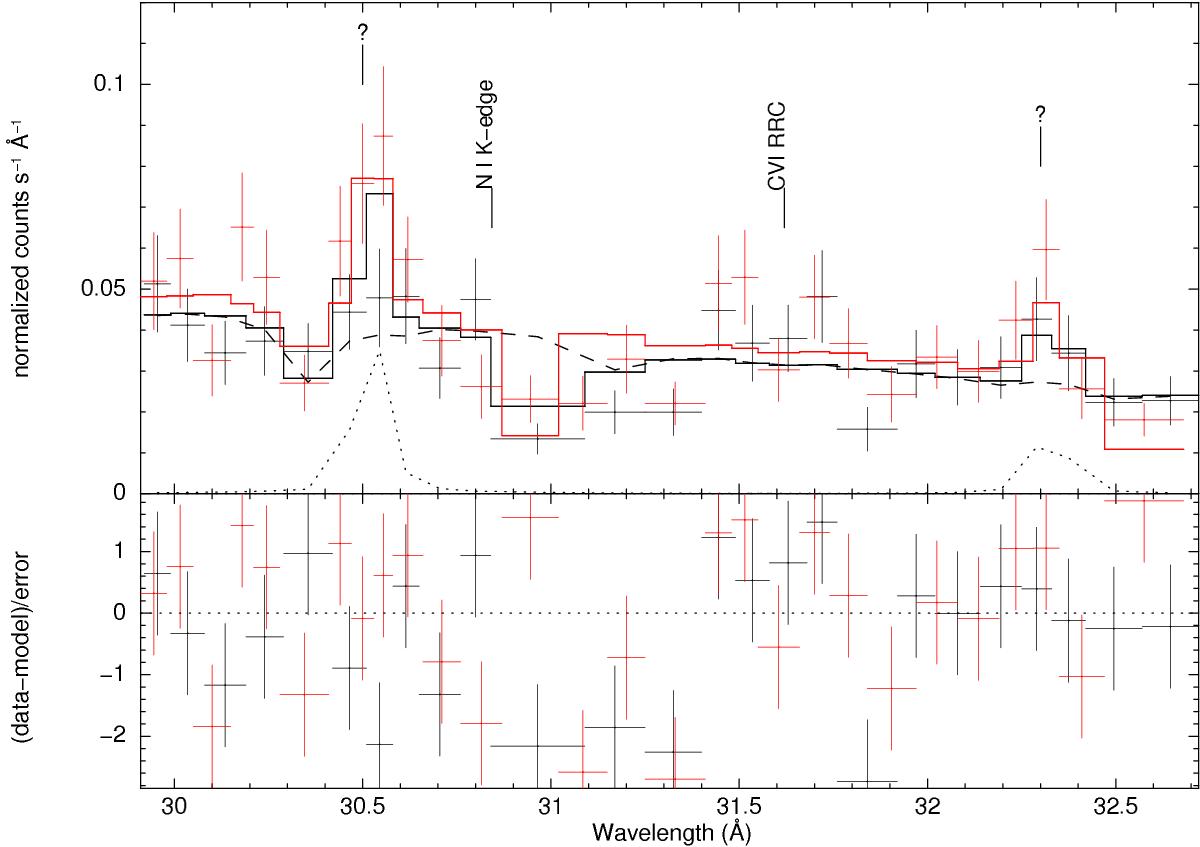
Detail of the RGS 1 (black) and RGS 2 (red) spectra in low-flux state around 30–32 Å, with several unidentified features fit by Gaussian lines in emission (dotted curves). The NI K absorption edge at 30.84 Å is not deep enough in the TBabs absorption model (dashed curves) and an extra absorption Gaussian is used in the total model (solid line) to fit the data in this range.
Current usage metrics show cumulative count of Article Views (full-text article views including HTML views, PDF and ePub downloads, according to the available data) and Abstracts Views on Vision4Press platform.
Data correspond to usage on the plateform after 2015. The current usage metrics is available 48-96 hours after online publication and is updated daily on week days.
Initial download of the metrics may take a while.