Fig. 2
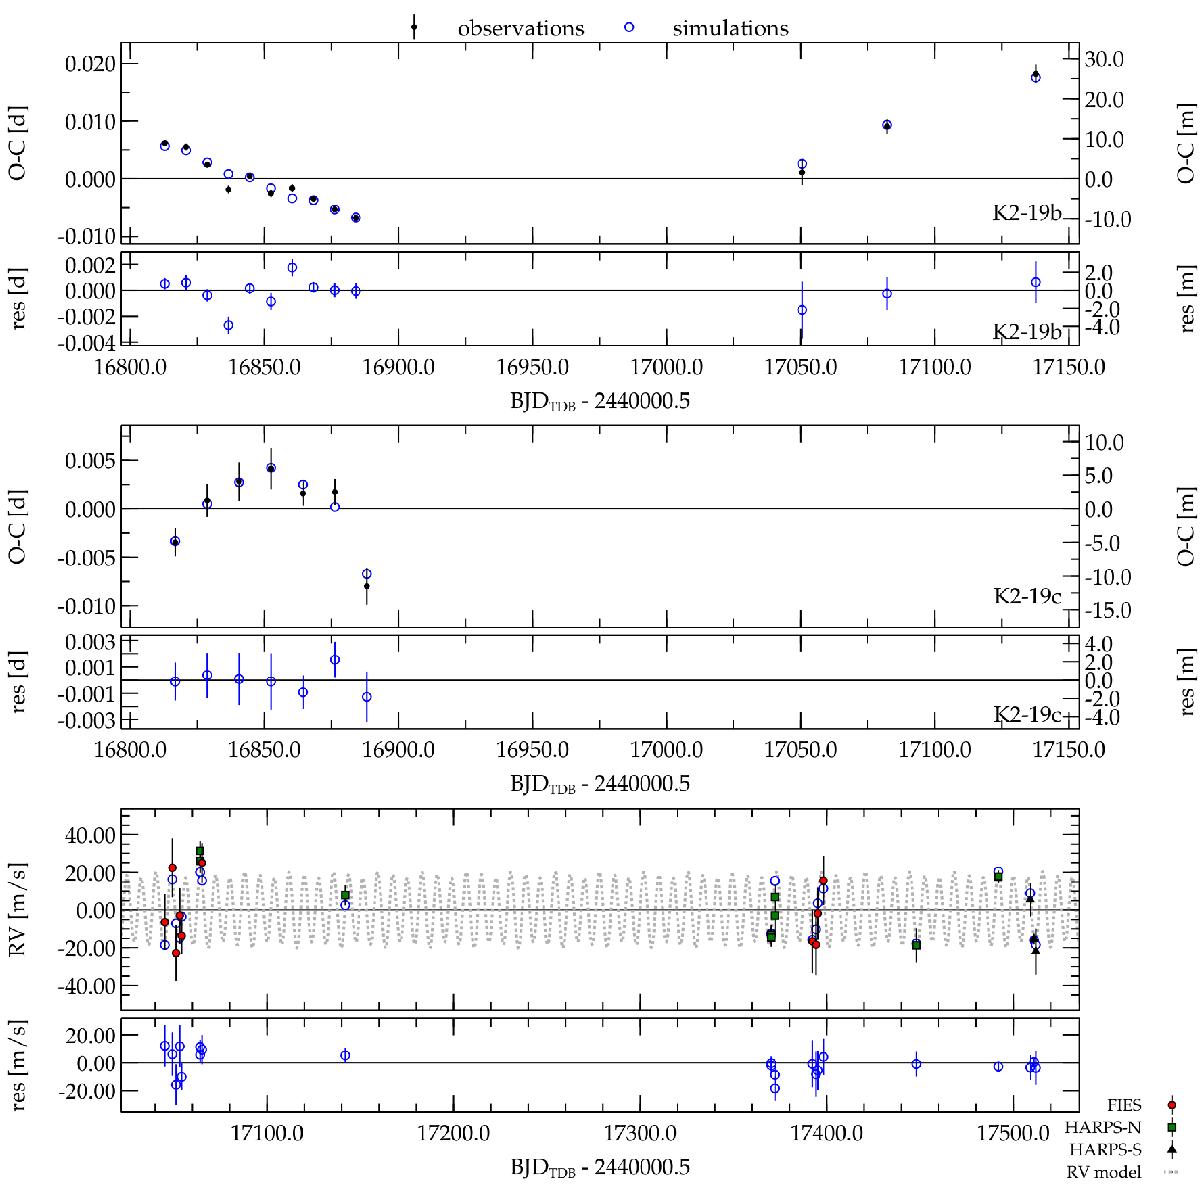
Upper panels: observed–calculated (O−C) times and residual plots for transit timings of K2-19b (top) and K2-19c (middle panel). O−C values were computed by subtracting a linear ephemeris from each timing measurement (black dots), taken from K2 data and from ground-based follow-up by Narita et al. (2015). Open blue circles indicate the best fitting model found by TRADES; the lower subpanels indicate the residuals of the TRADES-model. Bottom panel: radial velocity measurements from FIES (red circles), HARPS-N (green squares), and HARPS-S (black triangles), as well as the best fitting model from TRADES (blue open circles). The grey dotted line shows the TRADES RV model of both planets across the observation time window. Residuals against the model are shown in the lower subpanel.
Current usage metrics show cumulative count of Article Views (full-text article views including HTML views, PDF and ePub downloads, according to the available data) and Abstracts Views on Vision4Press platform.
Data correspond to usage on the plateform after 2015. The current usage metrics is available 48-96 hours after online publication and is updated daily on week days.
Initial download of the metrics may take a while.