Fig. 2
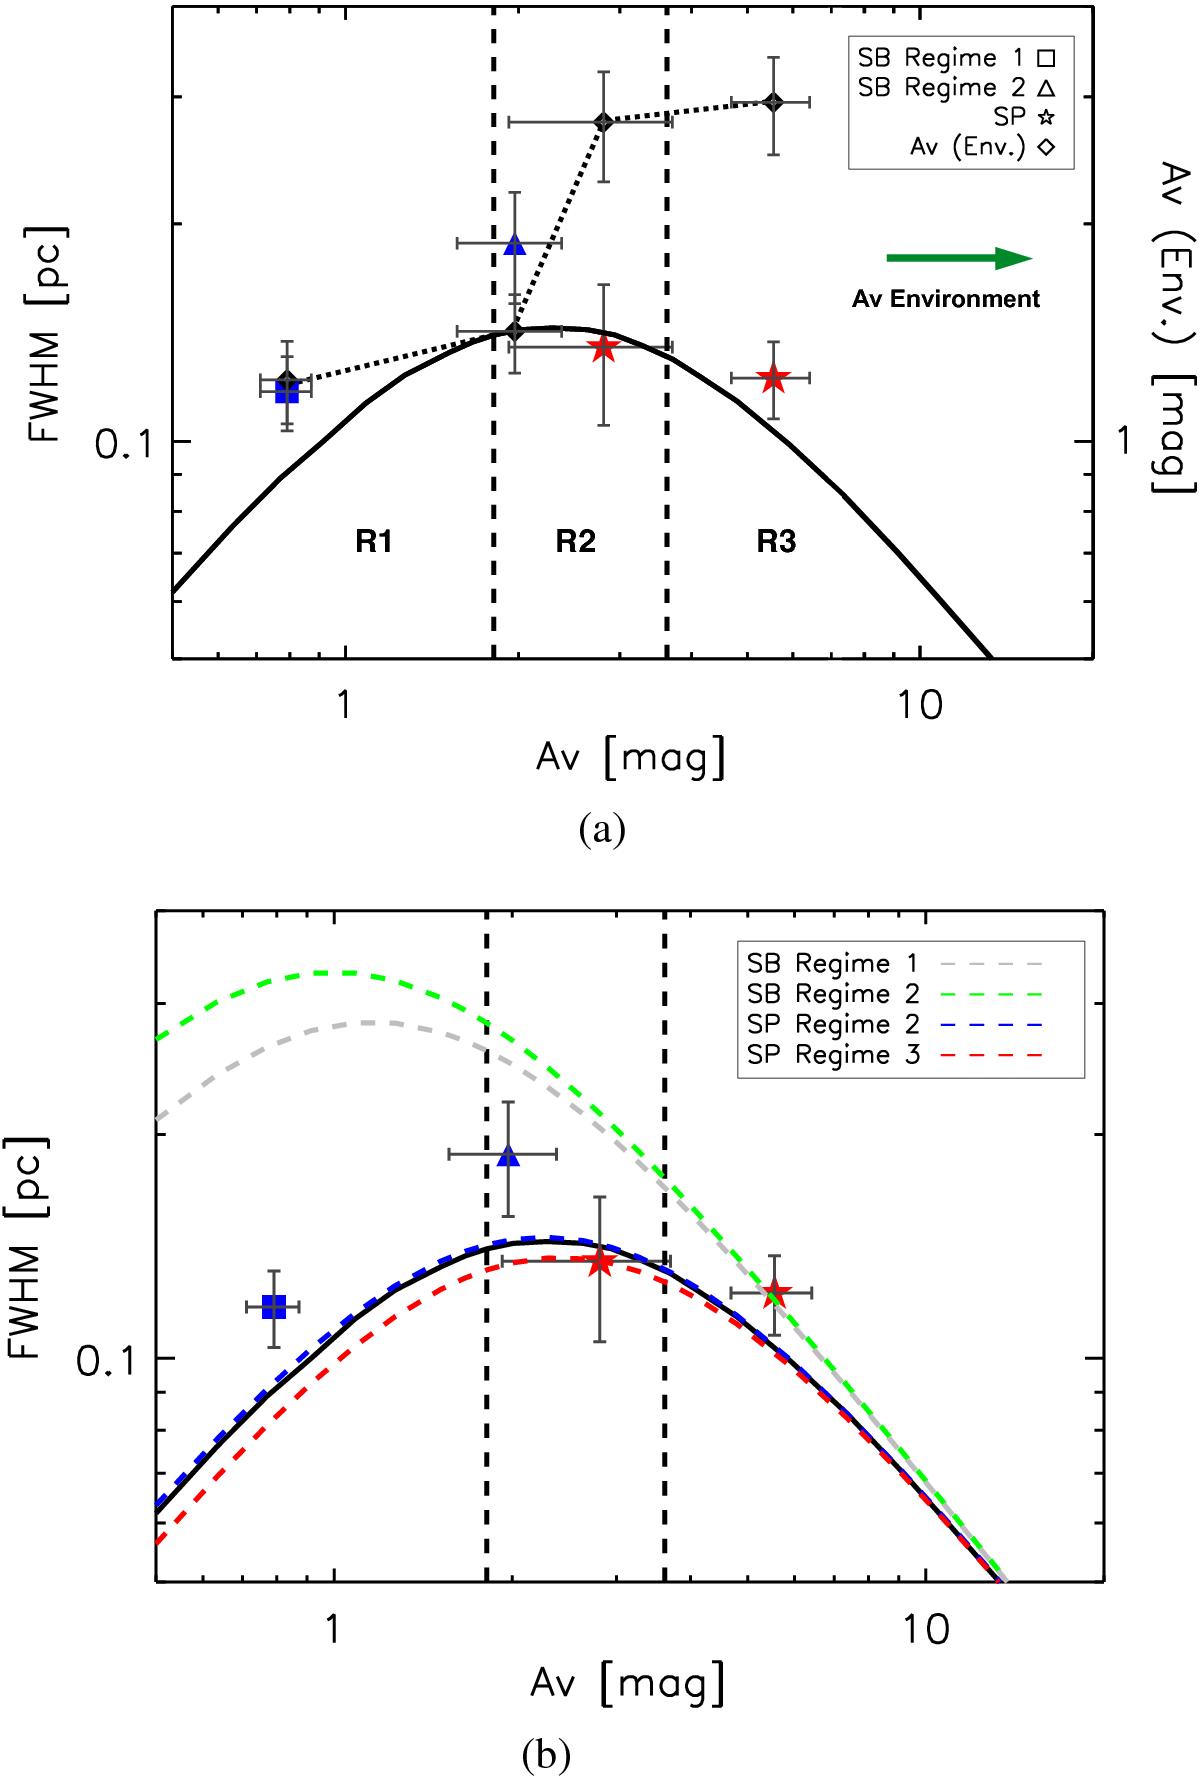
Panel a) mean filament FWHM as a function of central intrinsic (crest, background subtracted) filament AV. The black solid curve shows the model for isothermal pressure-confined filaments from Fischera & Martin (2012) for an external pressure pext/k = 2 × 10⁴ K cm-3, i.e. environment AV≈ 2.8 mag for μ = 2.33. Blue and red symbols represent the average change of filament width and crest AV for the transition from a core-dominated subcritical state (SB) to a wing-dominated supercritical state (SP). The average background for each filament group (AV (Env.); right axis), derived from the background maps provided by getsources (Sect. 3), is indicated with a black symbol at the characteristic crest AV of the group. The clear increase in environment column density with regime (crest AV) is highlighted with a green arrow. Vertical dashed lines mark the approximate boundaries of regimes 2 and 3 for a filament with FWHM ≈ 0.13 pc. Boundaries would shift to lower AV for larger FWHM. Error bars are the standard error on the mean for each type of filament. Panel b) same as panel a), but highlighting the theoretical curves corresponding to the average background of each group. Models were derived using the equations included in Fischera & Martin (2012).
Current usage metrics show cumulative count of Article Views (full-text article views including HTML views, PDF and ePub downloads, according to the available data) and Abstracts Views on Vision4Press platform.
Data correspond to usage on the plateform after 2015. The current usage metrics is available 48-96 hours after online publication and is updated daily on week days.
Initial download of the metrics may take a while.