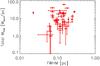
Fig. 1
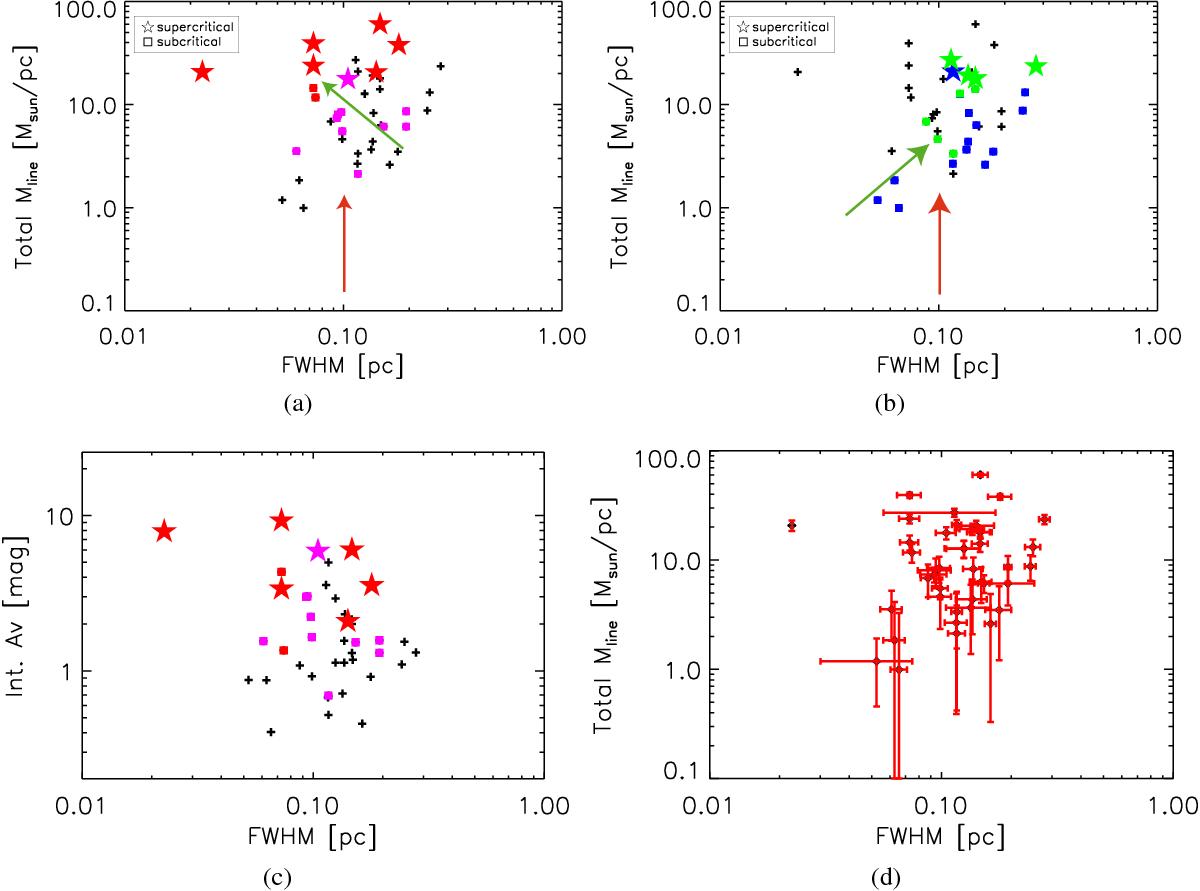
Filament characteristic intrinsic total linear mass density (Mline,tot) as a function of FWHM for HBs (filled red and magenta symbols; a)) and LBs (filled blue and green symbols b)) of the core-scale filament sample. Panel c) shows the AV−FWHM distribution for HBs. As reference, black crosses in Figs. 1a and 1b mark the position of filaments in low and high backgrounds, respectively. Panel d) is the same as a) and b), but with uncertainties included as reference. The red arrow indicates the evolutionary direction at constant ~ 0.1 pc width (e.g. Arzoumanian et al. 2011; 2013). The green arrow indicates an alternative evolutionary path leading to filaments with the same final properties and conveying similar changes as the original model, but allowing for a (conservative) change in filament width (see text). Separation according to the relative contribution of core or wing components to the filament Mline,tot is marked as follows: core dominated (blue and magenta for LBs and HBs, respectively), and wing dominated (green and red).
Current usage metrics show cumulative count of Article Views (full-text article views including HTML views, PDF and ePub downloads, according to the available data) and Abstracts Views on Vision4Press platform.
Data correspond to usage on the plateform after 2015. The current usage metrics is available 48-96 hours after online publication and is updated daily on week days.
Initial download of the metrics may take a while.