Fig. 2
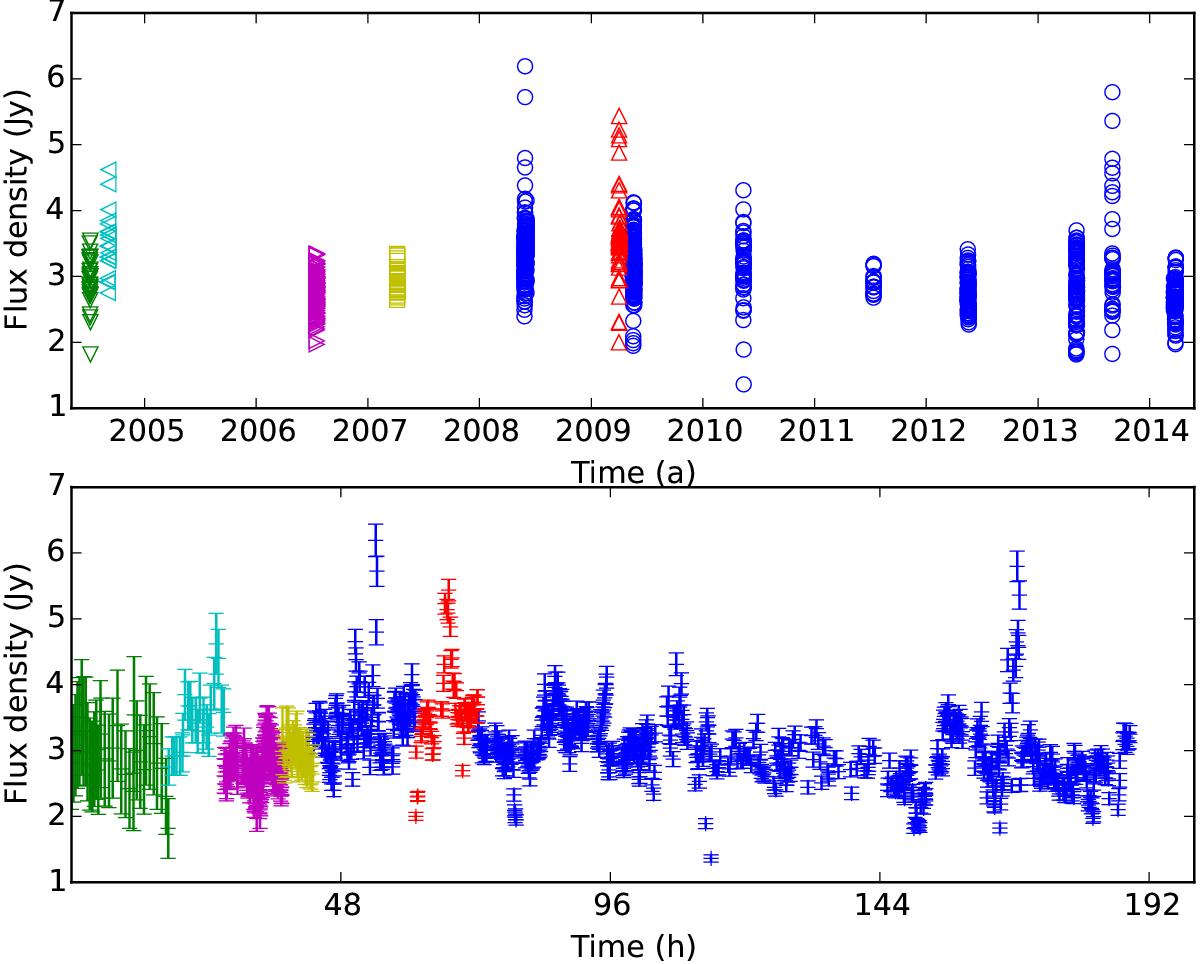
Top: all available submm light curves between 2004 and 2014. The plot contains both the LABOCA data (blue circles) and the literature data (green down-pointing triangles: Eckart et al. 2009; cyan left-pointing triangles: Yusef-Zadeh et al. 2006a; magenta right-pointing triangles: Yusef-Zadeh et al. 2008; yellow squares: Yusef-Zadeh et al. 2009; red up-pointing triangles: Trap et al. 2011). Bottom: a concatenated light curve of the submm data. Time gaps greater than 10 min were replaced by gaps of 300 s.
Current usage metrics show cumulative count of Article Views (full-text article views including HTML views, PDF and ePub downloads, according to the available data) and Abstracts Views on Vision4Press platform.
Data correspond to usage on the plateform after 2015. The current usage metrics is available 48-96 hours after online publication and is updated daily on week days.
Initial download of the metrics may take a while.