Fig. 9
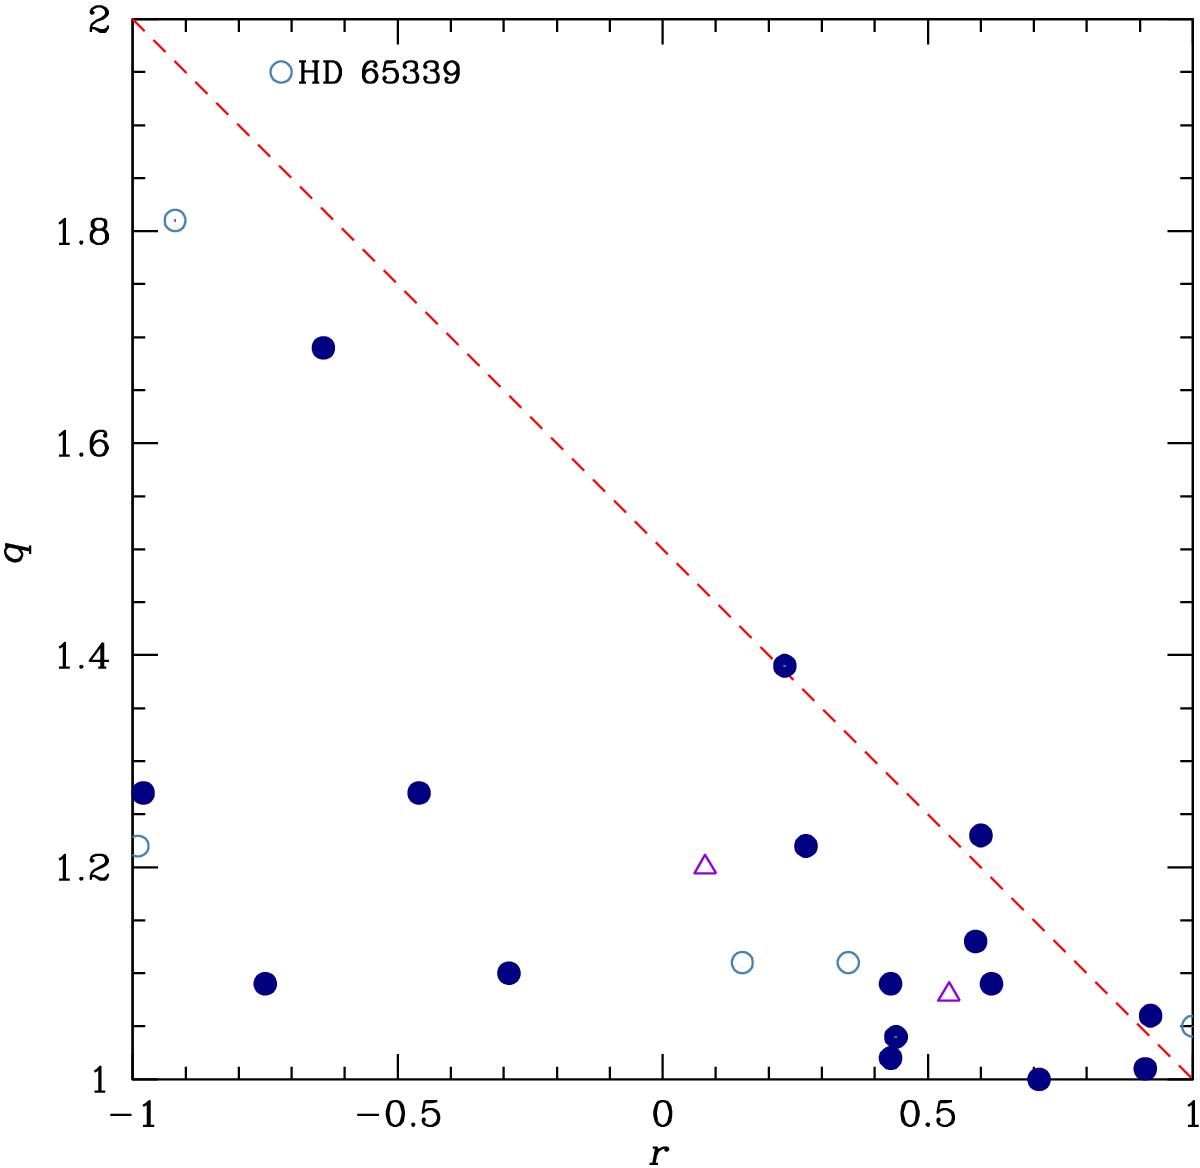
Relative amplitude q of the variation of the mean magnetic field modulus against the ratio r of the extrema of the mean longitudinal field (see text). Dots identify values of q computed from the ⟨ B ⟩ data of this paper and of Paper I; triangles are used for field moduli from the literature. Filled symbols correspond to stars for which the ⟨ Bz ⟩ measurements are based on CASPEC observations (this paper; Mathys 1994; Mathys & Hubrig 1997), open symbols to other good ⟨ Bz ⟩ measurements from the literature (references given in the text). The dashed diagonal line, q = (3−r)/2, emphasises the concentration of the majority of the stars of the sample in the lower left part of the figure: namely, high amplitudes of variation of ⟨ B ⟩ are observed when both the positive and negative magnetic poles of the star come into sight during its rotation cycle.
Current usage metrics show cumulative count of Article Views (full-text article views including HTML views, PDF and ePub downloads, according to the available data) and Abstracts Views on Vision4Press platform.
Data correspond to usage on the plateform after 2015. The current usage metrics is available 48-96 hours after online publication and is updated daily on week days.
Initial download of the metrics may take a while.