Fig. A.40
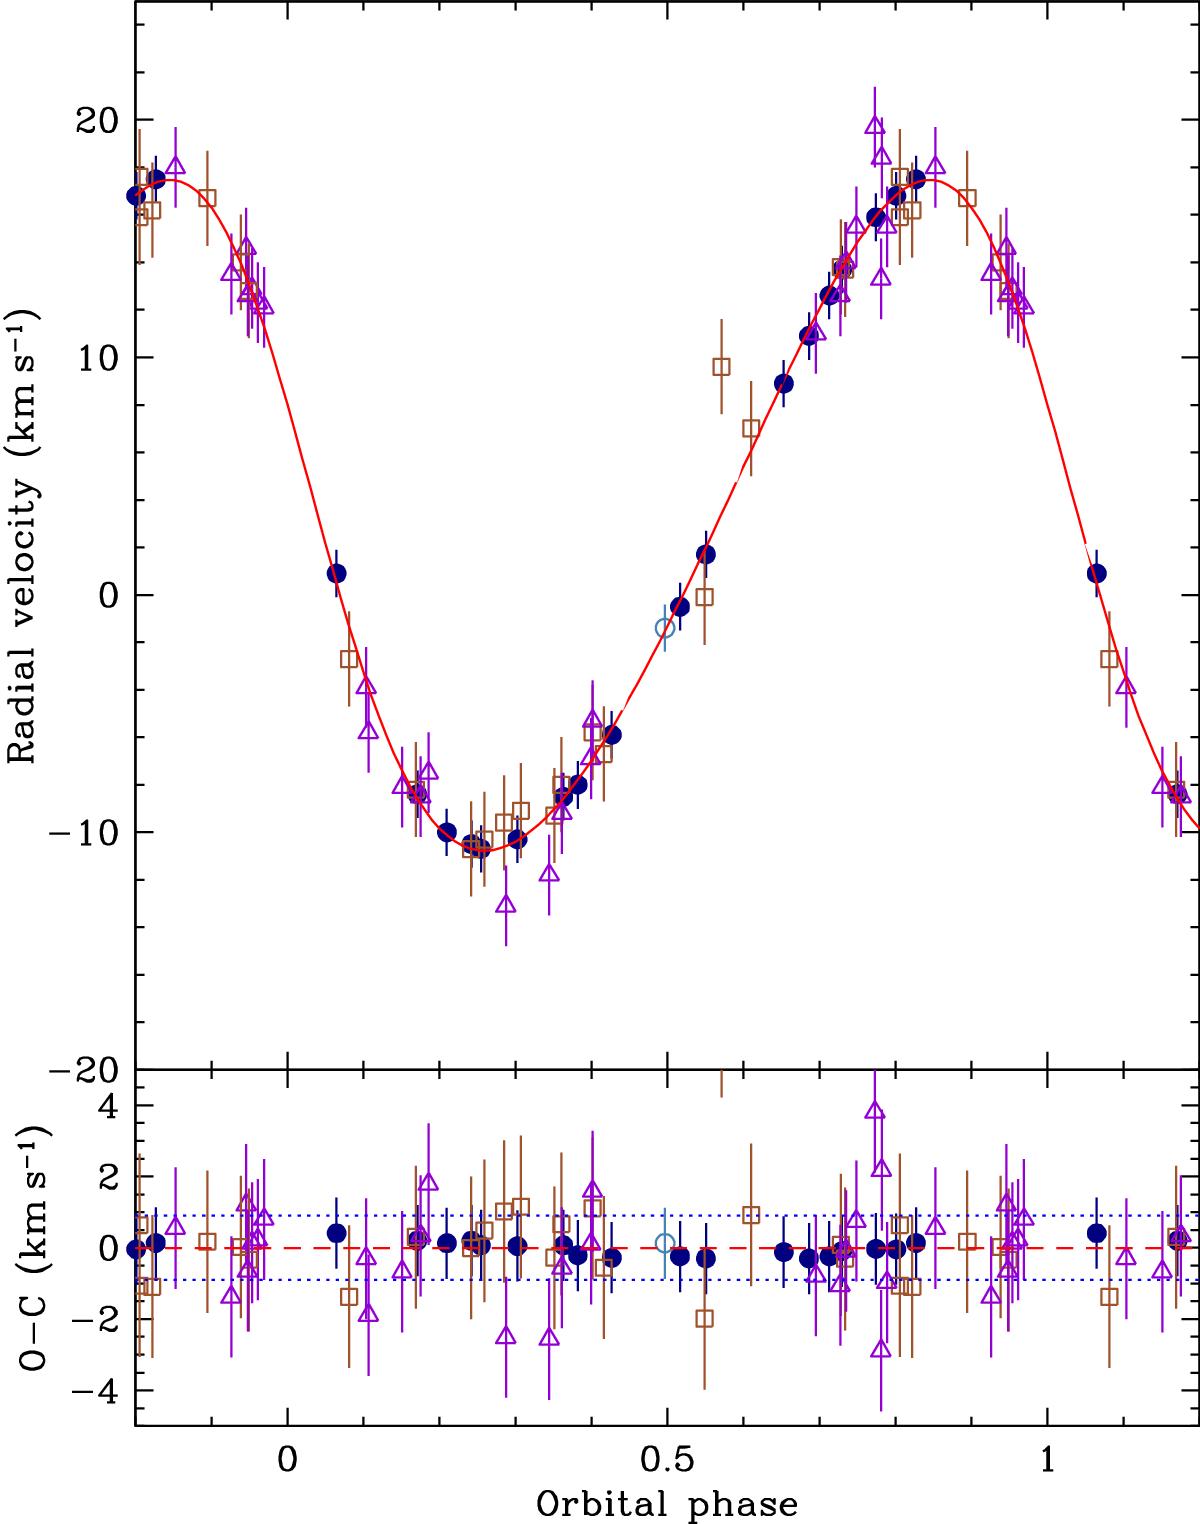
Upper panel: our radial velocity measurements for HD 116458 are plotted together with those of Dworetsky (1982) against orbital phase. The solid curve corresponds to the orbital solution given in Table 12. The time T0 of periastron passage is adopted as phase origin. Bottom panel: plot of the differences O−C between the observed values of the radial velocity and the predicted values computed from the orbital solution. The dotted lines correspond to ± 1 rms deviation of the observational data about the orbital solution (dashed line). Open triangles represent the data from Dworetsky and open squares our CASPEC observations; all other symbols refer to our high-resolution spectra obtained with various instrumental configurations, as indicated in Table 3.
Current usage metrics show cumulative count of Article Views (full-text article views including HTML views, PDF and ePub downloads, according to the available data) and Abstracts Views on Vision4Press platform.
Data correspond to usage on the plateform after 2015. The current usage metrics is available 48-96 hours after online publication and is updated daily on week days.
Initial download of the metrics may take a while.