Free Access
Fig. 3
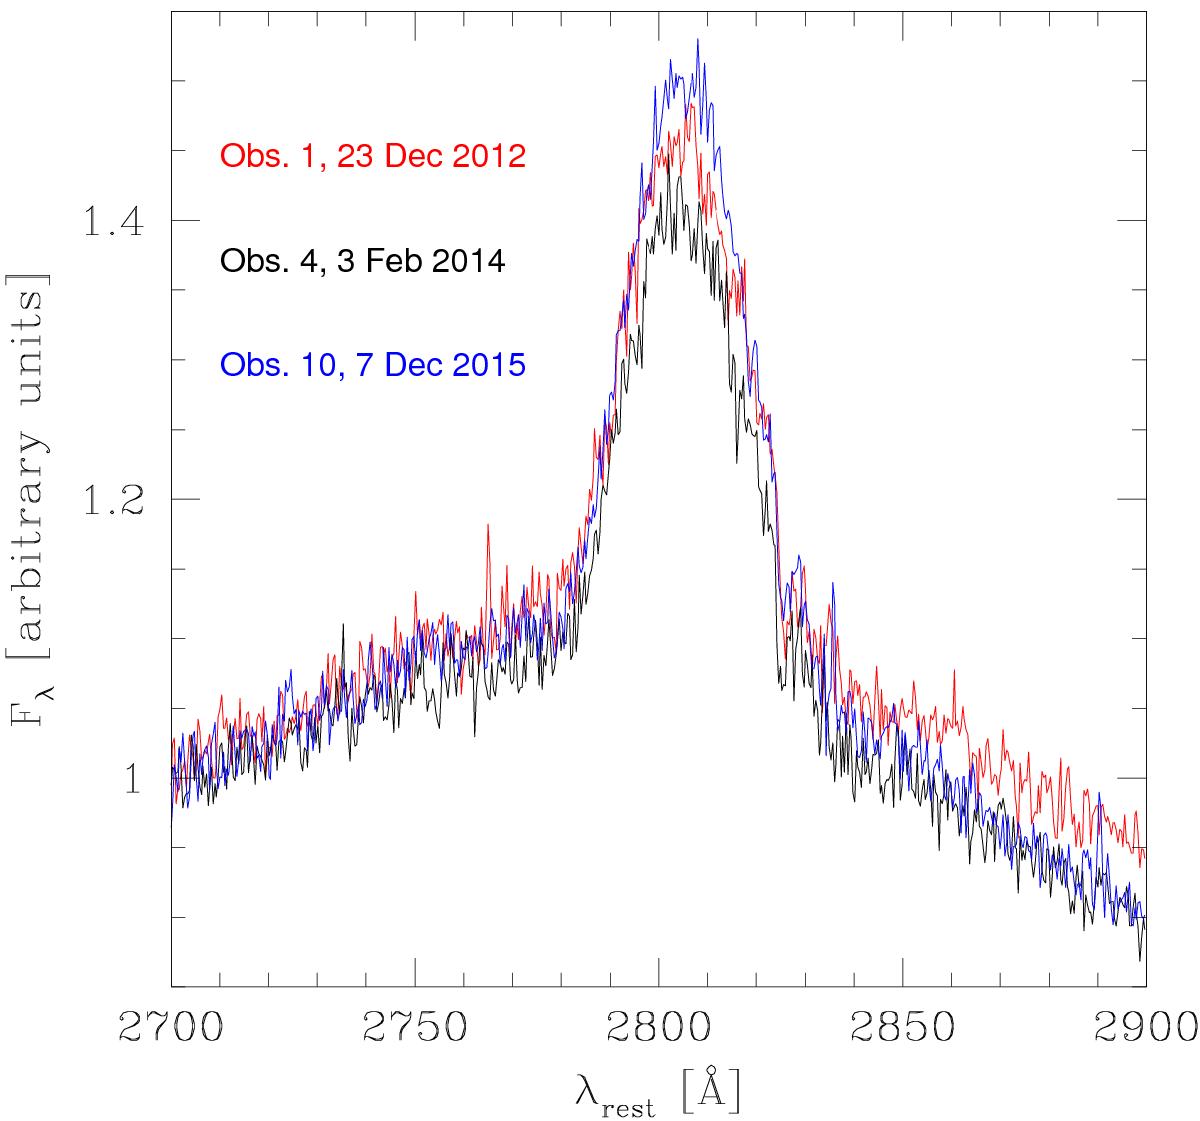
Three examples of quasar spectra in the Mg II region, renormalized to the 2700 Å flux, clearly show variations of the Mg II line, but accompanied with the variability of the underlying Fe II and the power law slope.
Current usage metrics show cumulative count of Article Views (full-text article views including HTML views, PDF and ePub downloads, according to the available data) and Abstracts Views on Vision4Press platform.
Data correspond to usage on the plateform after 2015. The current usage metrics is available 48-96 hours after online publication and is updated daily on week days.
Initial download of the metrics may take a while.