Fig. 7
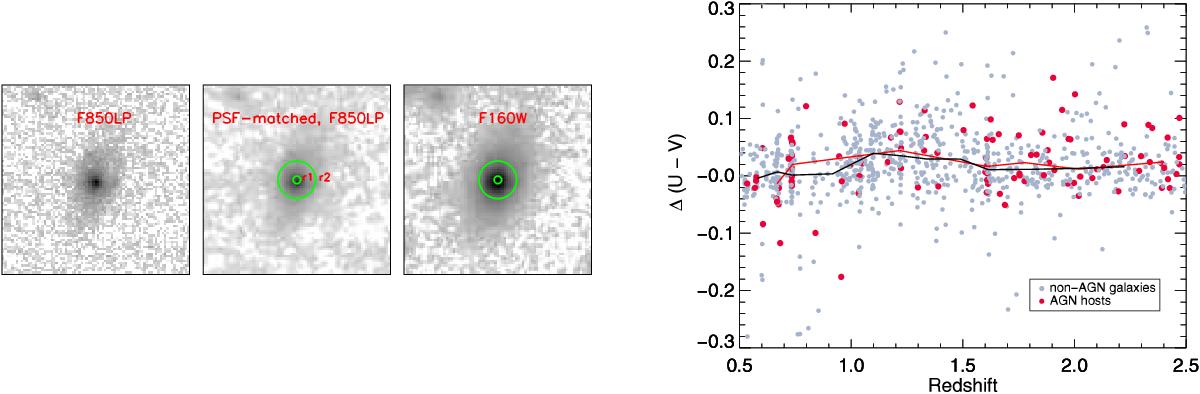
Left: representative sample images of one AGN in our sample in HST/ACS F850LP band, HST/ACS F850LP band (after PSF-matched) and WFC3/IR F160W images. The green circles represent the apertures we used to assess the AGN contribution on host colors. Right: redshift vs. Δ(U−V) for AGN hosts and non-AGN galaxies in GOODS-South. The red and black lines denote the sliding median for AGN hosts and non-AGN galaxies, respectively.
Current usage metrics show cumulative count of Article Views (full-text article views including HTML views, PDF and ePub downloads, according to the available data) and Abstracts Views on Vision4Press platform.
Data correspond to usage on the plateform after 2015. The current usage metrics is available 48-96 hours after online publication and is updated daily on week days.
Initial download of the metrics may take a while.