Fig. 6
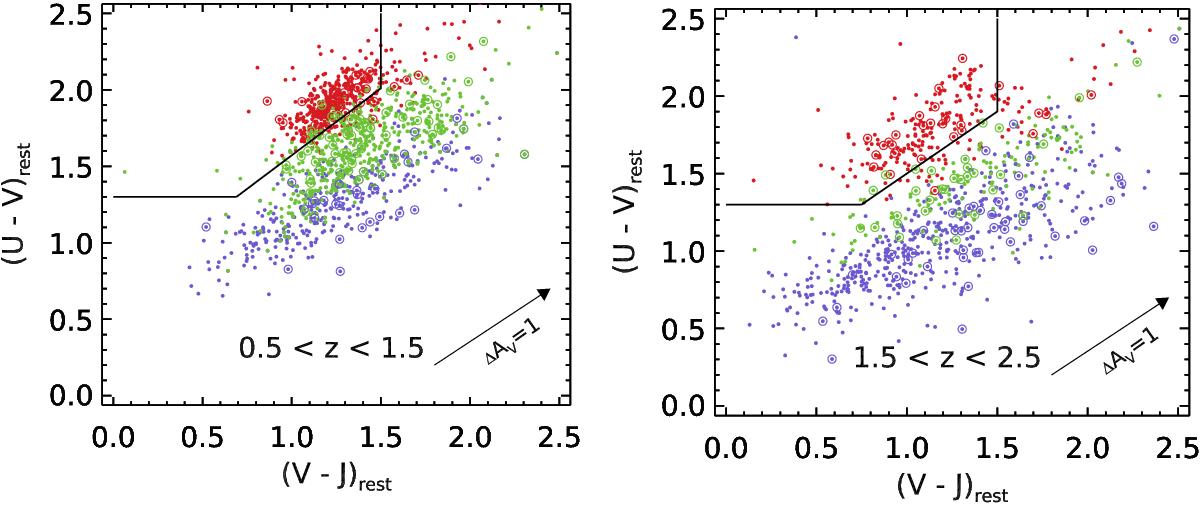
Distribution of galaxies in rest-frame U−V color vs. V−J color. Red, blue, and green dots indicate red, blue and green galaxy populations, respectively, while the large circles represent AGN hosts in each population. The solid line denotes the dividing line between star-forming and quiescent galaxies (Whitaker et al. 2012; Muzzin et al. 2013). The distribution of our classified red and blue populations is consistent with expectations of quiescent and star-forming galaxies in this diagram. Moreover, the green populations fall in between them, consistent with being a transition population.
Current usage metrics show cumulative count of Article Views (full-text article views including HTML views, PDF and ePub downloads, according to the available data) and Abstracts Views on Vision4Press platform.
Data correspond to usage on the plateform after 2015. The current usage metrics is available 48-96 hours after online publication and is updated daily on week days.
Initial download of the metrics may take a while.