Fig. 5
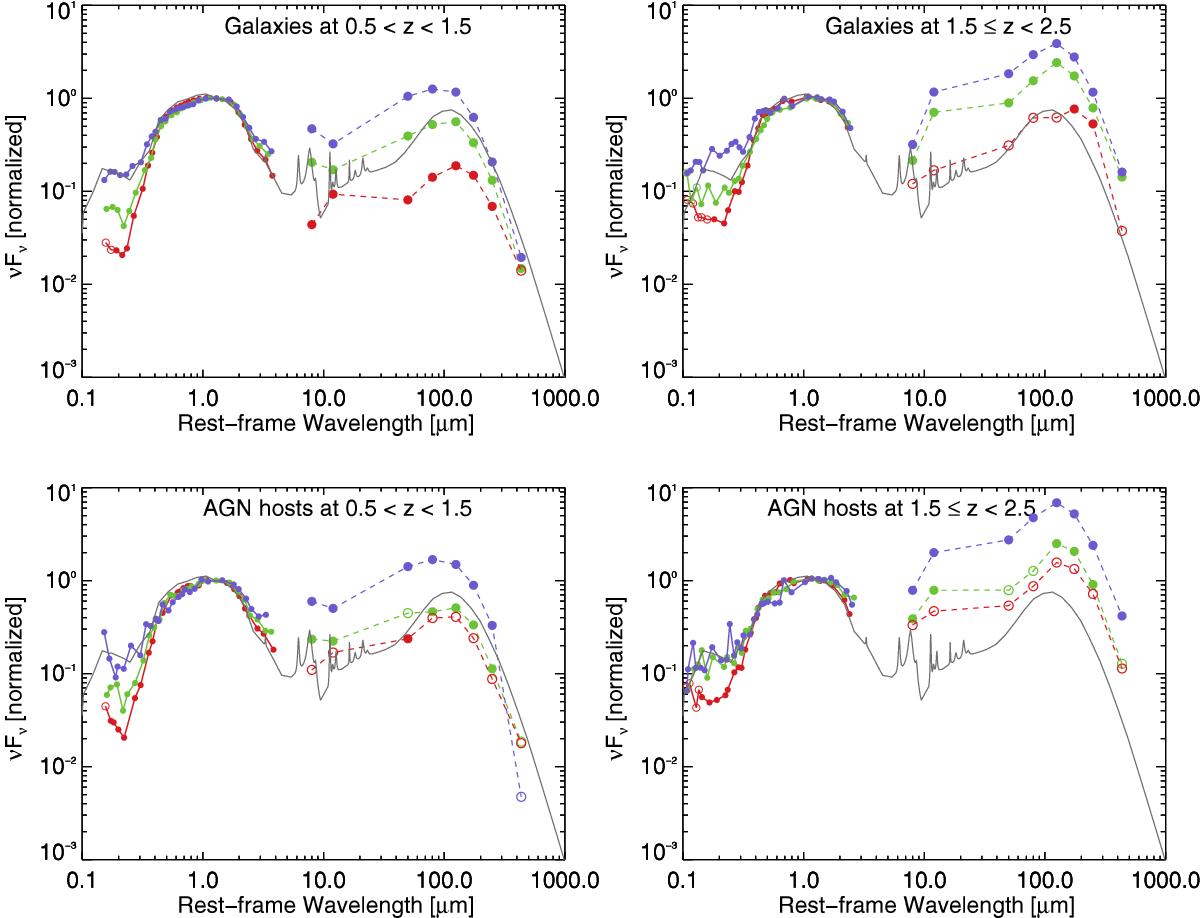
Composite UV-to-FIR SEDs of the red, blue and green galaxies (the upper two panels) and AGN hosts (the lower two panels). The UV-to-NIR SEDs of galaxies in each population are de-redshifted to rest-frame and normalized to unity at J band (~1.25 μm), then projected onto a common wavelength grid. At each wavelength we derive the median and denote as filled symbols. If more than half of the sample is not detected within a wavelength grid, then we denote the median as open circles. The FIR fluxes from stacking are also normalized at J band. FIR data points for non-detections (S/N < 3) in the stacking are shown with their 3σ upper limits, and are denoted by open circles. For reference, we over-plot a UV-to-FIR SED of a nearby spiral galaxy (a blue galaxy based on our classification), M 51, from the Grasil model (Silva et al. 1998).
Current usage metrics show cumulative count of Article Views (full-text article views including HTML views, PDF and ePub downloads, according to the available data) and Abstracts Views on Vision4Press platform.
Data correspond to usage on the plateform after 2015. The current usage metrics is available 48-96 hours after online publication and is updated daily on week days.
Initial download of the metrics may take a while.