Fig. 4
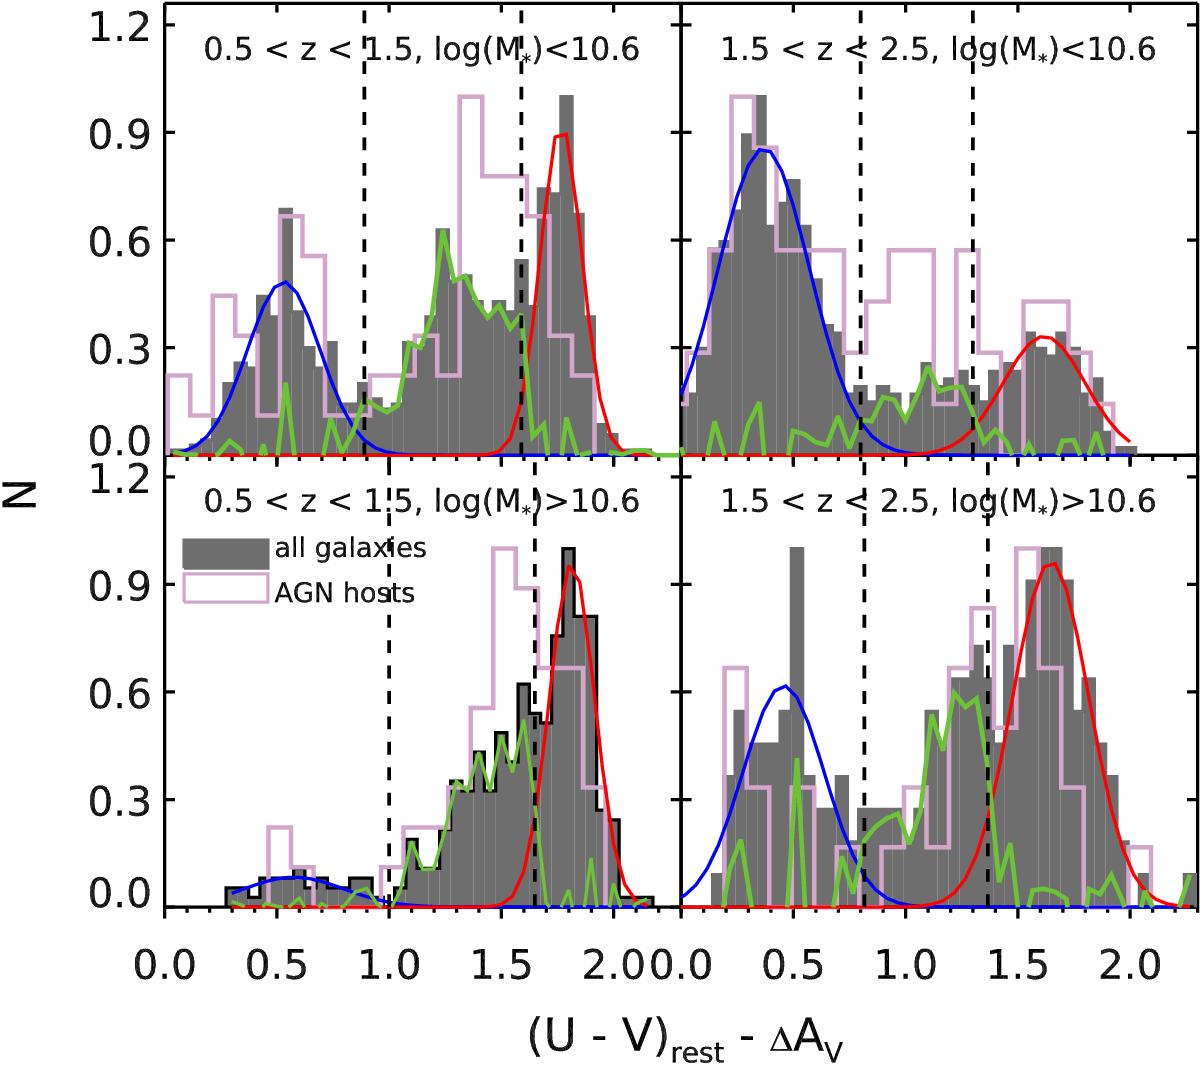
Histograms of extinction-corrected rest-frame U−V color for AGN hosts (solid magenta lines) and parent galaxies (gray filled histogram) in two ranges of stellar mass, 10 < log M⊙ < 10.6 and log M⊙ > 10.6, respectively. The peak value of each histogram has been rescaled to unity. Red and blue lines are the Gaussian fitting results for red sequence and blue cloud, and the solid green lines mark the residual distribution after subtracting the sum of the two Gaussians. The vertical dashed lines indicate the boundaries of the green valley, where the residual distribution surpass the Gaussian fit for blue (blue-side) or red (red-side) galaxies.
Current usage metrics show cumulative count of Article Views (full-text article views including HTML views, PDF and ePub downloads, according to the available data) and Abstracts Views on Vision4Press platform.
Data correspond to usage on the plateform after 2015. The current usage metrics is available 48-96 hours after online publication and is updated daily on week days.
Initial download of the metrics may take a while.