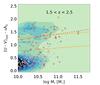
Fig. 3
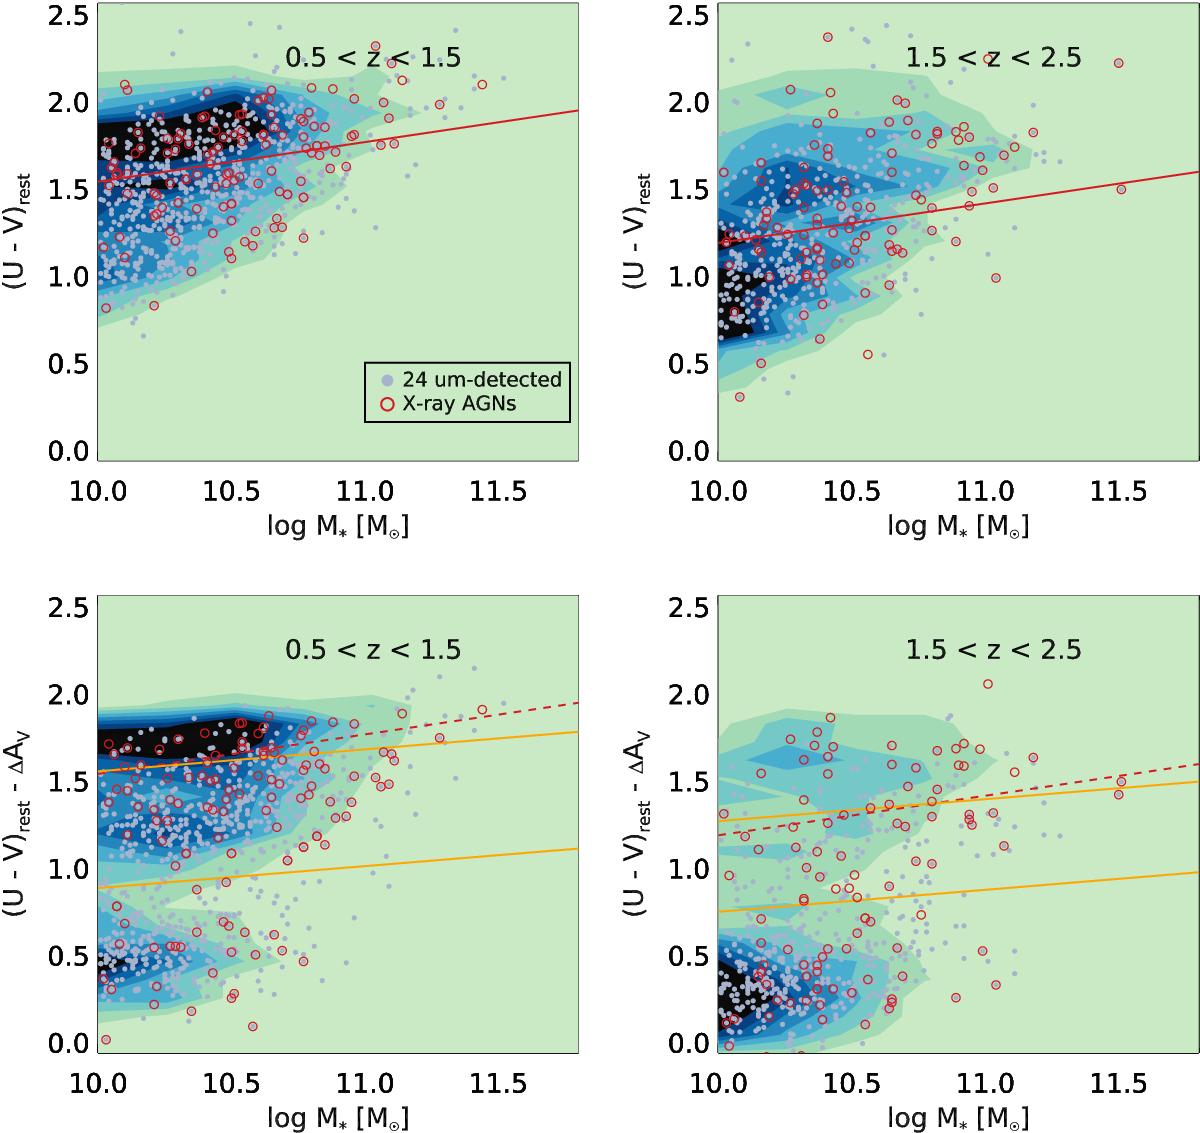
Rest-frame color-mass relation (CMR), before (the upper two panels) and after (the lower two panels) extinction correction, for all galaxies in our sample. The left two panels show the CMR at 0.5 < z < 1.5 while the right two panels show the CMR at 1.5 ≤ z < 2.5. AGN hosts and 24 μm-detected galaxies are denoted by red open circles and grey filled circles, respectively. The contours indicate the density distribution of galaxies in the CMR. The separations between red sequence and blue cloud based on observed colors (without extinction-correction) from Borch et al. (2006) are shown by solid (top two panels) and dashed (bottom two panels) red lines. The orange lines in the bottom two panels indicate the separation between red sequence, green valley, and blue cloud based on extinction-corrected colors derived in this work. After extinction correction, the fraction of red galaxies with 24 μm detections (f24 μm > 30 μJy) is significantly reduced (from ~38% to ~14% at z ~ 1 and ~47% to ~17% at z ~ 2) suggesting that the extinction-corrected color successfully separates red galaxies due to dust attenuation from those due to old stellar populations.
Current usage metrics show cumulative count of Article Views (full-text article views including HTML views, PDF and ePub downloads, according to the available data) and Abstracts Views on Vision4Press platform.
Data correspond to usage on the plateform after 2015. The current usage metrics is available 48-96 hours after online publication and is updated daily on week days.
Initial download of the metrics may take a while.