Fig. 13
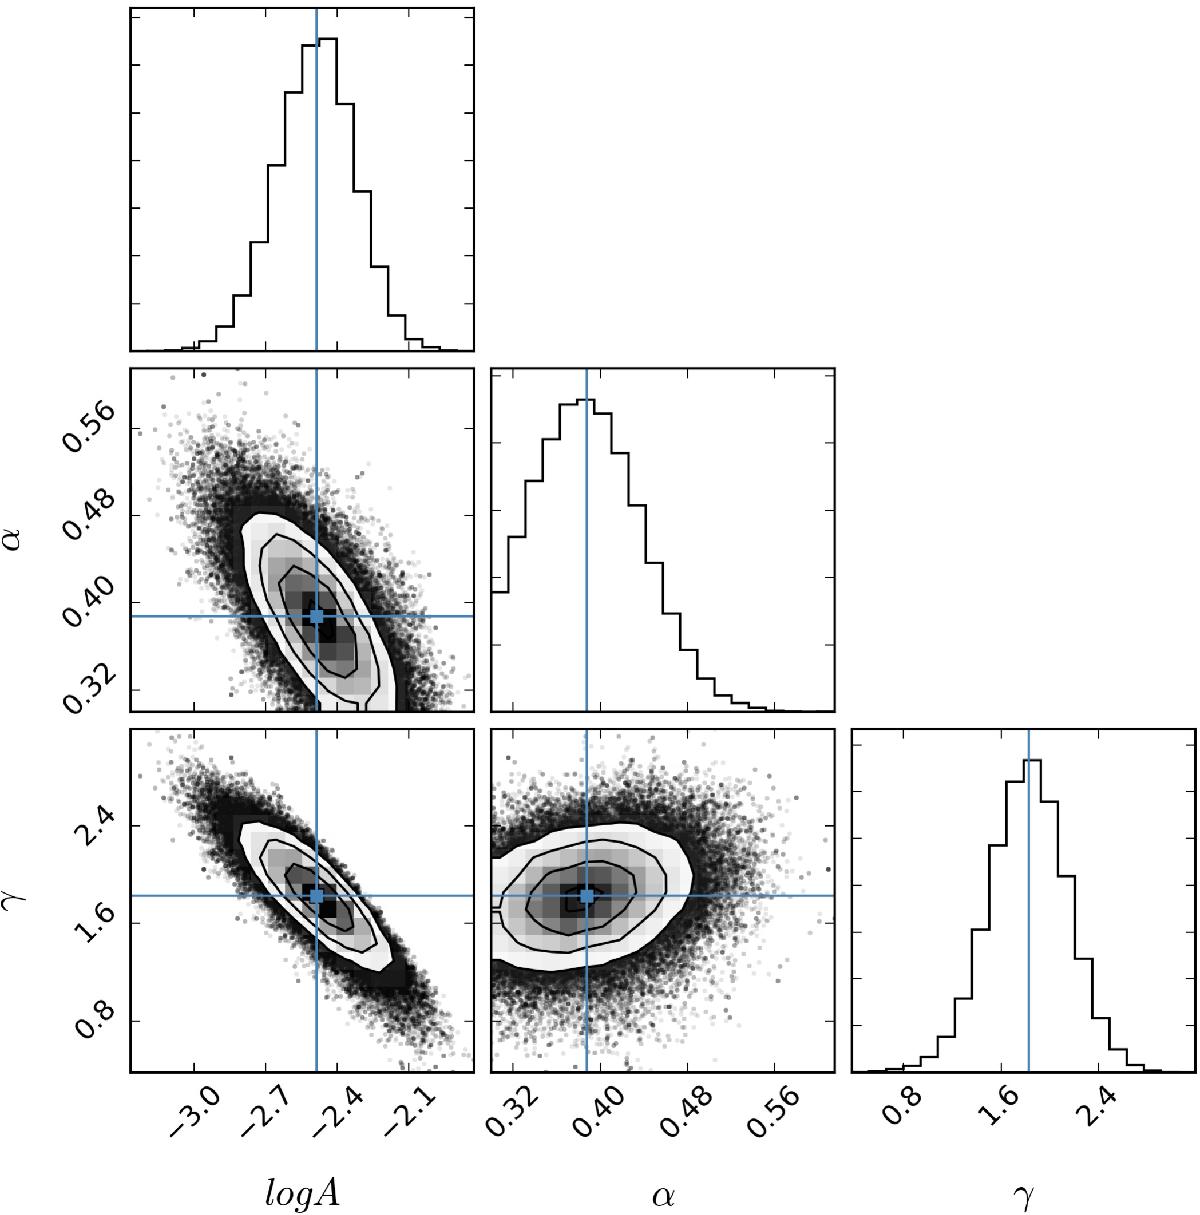
Posterior probability distributions of the three parameters defining p(λEdd) in Eq. (8) for the whole galaxy population (all galaxies) across 0.5 <z< 2.5 from the MCMC analysis. The solid lines denote the best-fit values for each parameter, which are also listed in Table 3. The density contours show the 68.3, 90, and 95 percent posterior confidence probabilities.
Current usage metrics show cumulative count of Article Views (full-text article views including HTML views, PDF and ePub downloads, according to the available data) and Abstracts Views on Vision4Press platform.
Data correspond to usage on the plateform after 2015. The current usage metrics is available 48-96 hours after online publication and is updated daily on week days.
Initial download of the metrics may take a while.