Fig. 12
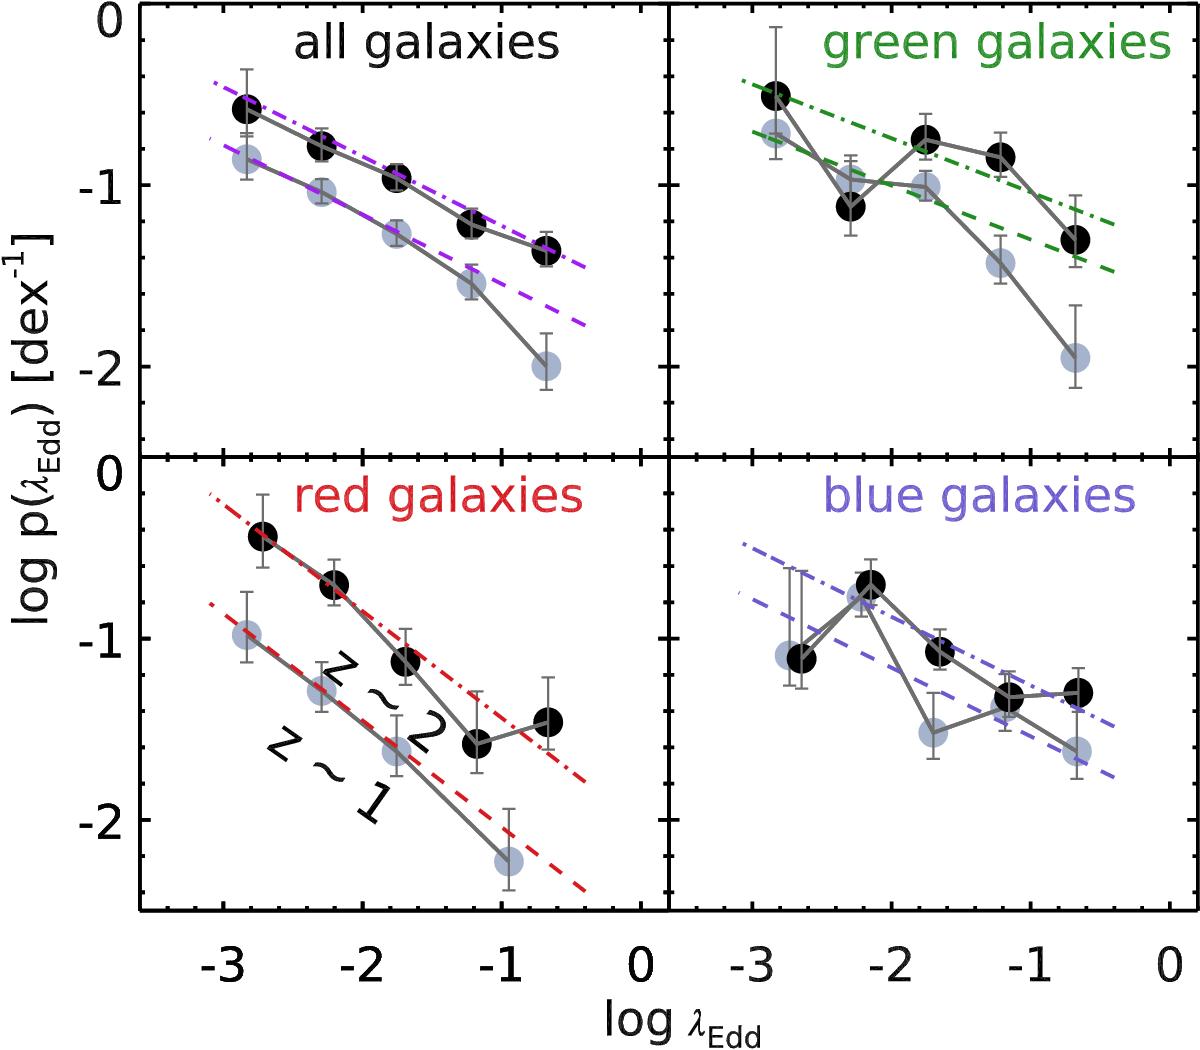
As for Fig. 11, but here we show the binned λEdd distribution for each population separately. In each panel, the λEdd distribution at z ~ 2 and z ~ 1 is shown with filled squares and circles, respectively. The best-fit models of p(λEdd) from MXL fitting of the unbinned data (Table 3) at two redshifts (z ~ 1,2) are shown by dashed and dot-dashed lines, respectively.
Current usage metrics show cumulative count of Article Views (full-text article views including HTML views, PDF and ePub downloads, according to the available data) and Abstracts Views on Vision4Press platform.
Data correspond to usage on the plateform after 2015. The current usage metrics is available 48-96 hours after online publication and is updated daily on week days.
Initial download of the metrics may take a while.