Fig. A.3
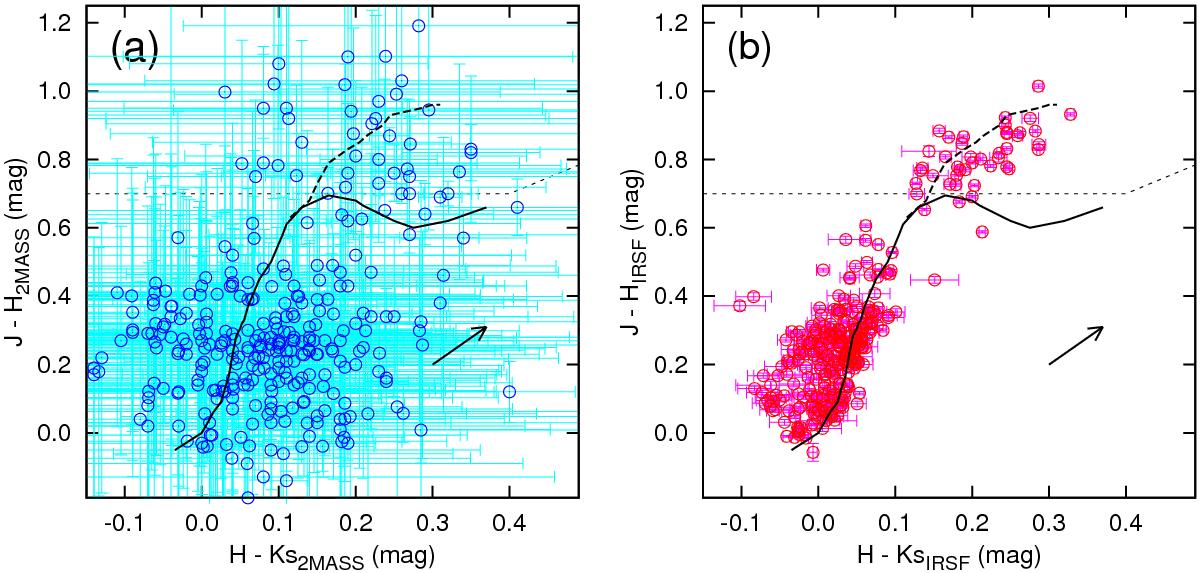
a) J−H versus H−Ks color−color diagram of bright main-sequence stars based on the 2MASS measurements. The solid curve indicates locus of main-sequence stars while the dotted curve indicates that of giant stars (Bessell & Brett 1988). The solid arrow shows the interstellar extinction vector for Av = 1 mag, using the Weingartner & Draine (2001) Milky Way model of Rv = 3.1. b) Same as a), but for the IRSF measurements. The objects above dashed lines are removed from our main-sequence sample because they might be giant stars.
Current usage metrics show cumulative count of Article Views (full-text article views including HTML views, PDF and ePub downloads, according to the available data) and Abstracts Views on Vision4Press platform.
Data correspond to usage on the plateform after 2015. The current usage metrics is available 48-96 hours after online publication and is updated daily on week days.
Initial download of the metrics may take a while.