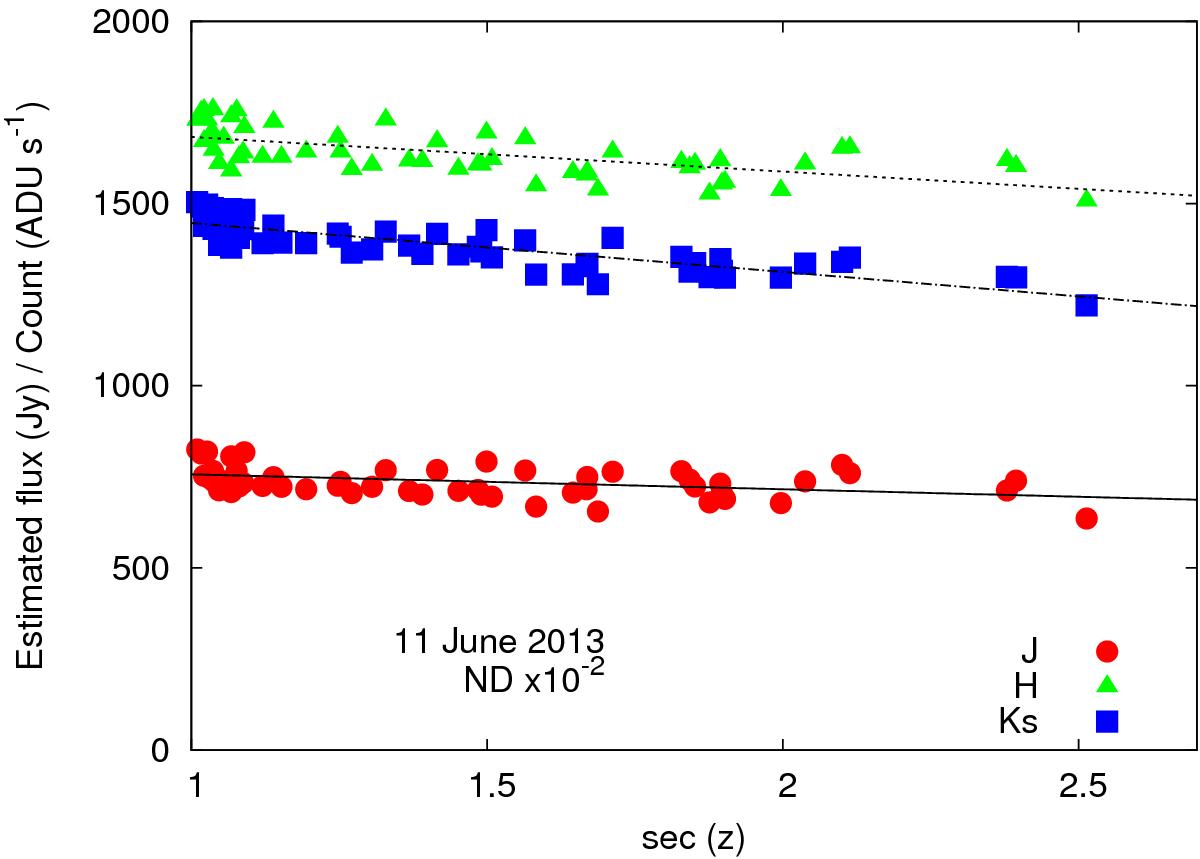
Fig. A.1

Ratio of the estimated fluxes over the observed fluxes of standard stars as a function of sec(z). This example is of the observation on 11th June 2013. This plot is made for every night for every ND filters. The circle, triangle, and square indicate the J, H, and Ks bands, respectively. The solid line, the dotted line, and the dot-dashed line indicate fitting results for the J, H, and Ks bands, respectively.
Current usage metrics show cumulative count of Article Views (full-text article views including HTML views, PDF and ePub downloads, according to the available data) and Abstracts Views on Vision4Press platform.
Data correspond to usage on the plateform after 2015. The current usage metrics is available 48-96 hours after online publication and is updated daily on week days.
Initial download of the metrics may take a while.


