Fig. 5
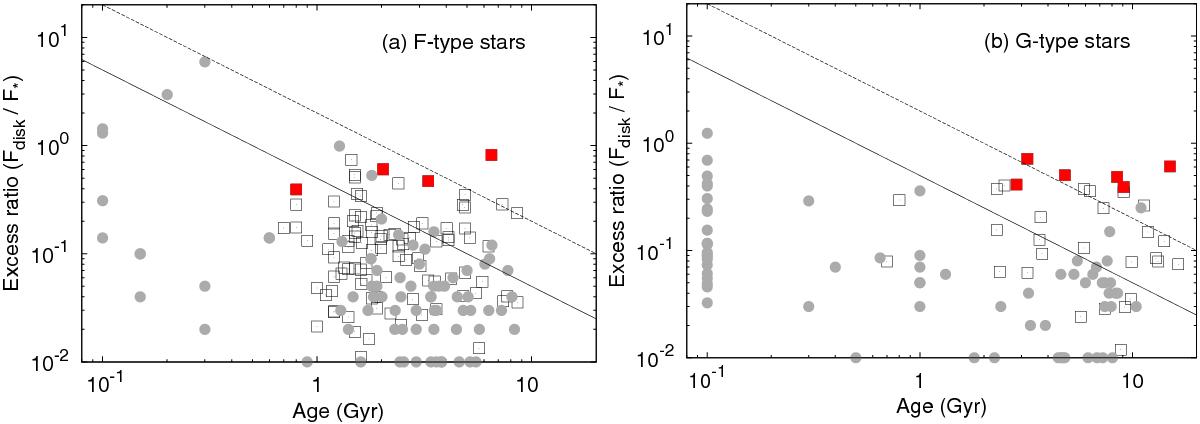
a)Fdisk/F∗ at AKARI 18 μm versus stellar age for F-type stars. Filled circles indicate debris disk samples from previous works at 24 μm by Spitzer/MIPS (Beichman et al. 2005, 2006; Bryden et al. 2006; Chen et al. 2005a,b; Hillenbrand et al. 2008; Trilling et al. 2008). Filled squares represent excess ratios observed by AKARI at 18 μm for stars with excesses larger than 3σ (debris disk candidates), while open squares show that for all stars in our sample. The solid line indicates the evolutionary track with t0 = 0.5 Gyr, where t0 is the dissipation time scale, while the dotted line indicates evolutionary track of t0 = 2 Gyr (see text for details). b) Same as a) but for G-type stars.
Current usage metrics show cumulative count of Article Views (full-text article views including HTML views, PDF and ePub downloads, according to the available data) and Abstracts Views on Vision4Press platform.
Data correspond to usage on the plateform after 2015. The current usage metrics is available 48-96 hours after online publication and is updated daily on week days.
Initial download of the metrics may take a while.